A growing directory of R packages with at least one RLadies+ member among the authors or maintainers. The list lives in its own GitHub repository — contributions are welcome. Click any package below to open its documentation site or source repository.
0
R Packages
- adjclust adjclust by Christophe Ambroise, Shubham Chaturvedi, Alia Dehman + 4 more. Implements a constrained version of hierarchical agglomerative clustering, in which each observation is associated to a position, and only adjacent clusters can be merged. Typical application fields in bioinformatics include Genome-Wide Association Studies or Hi-C data analysis, where the similarity between items is a decreasing function of their genomic distance. Taking advantage of this feature, the implemented algorithm is time and memory efficient. This algorithm is described in Ambroise et al (2019) <doi:10.1186/s13015-019-0157-4>.
- ADTSA ADTSA by Hossein Hassani, Masoud Yarmohammadi, Mohammad Reza Yeganegi + 1 more. Analyzes autocorrelation and partial autocorrelation using surrogate methods and bootstrapping, and computes the acceleration constants for the vectorized moving block bootstrap provided by this package. It generates percentile, bias-corrected, and accelerated intervals and estimates partial autocorrelations using Durbin-Levinson. This package calculates the autocorrelation power spectrum, computes cross-correlations between two time series, computes bandwidth for any time series, and performs autocorrelation frequency analysis. It also calculates the periodicity of a time series.
 agroclimatico by Elio Campitelli, Paola Corrales, Natalia Gattinoni. Conjunto de funciones para calcular índices y estadísticos climáticos hidrológicos a partir de datos tidy. Incluye una función para graficar resultados georeferenciados y e información cartográfica.
 airports by Mine Çetinkaya-Rundel. Geographic, use, and property related data on airports.
- anicon anicon by Emi Tanaka. This package allows easy insertion of animated icons into R Markdown html outputs.
- AnnotationHub AnnotationHub by Bioconductor Package Maintainer, Martin Morgan, Lori Shepherd. This package provides a client for the Bioconductor AnnotationHub web resource. The AnnotationHub web resource provides a central location where genomic files (e.g., VCF, bed, wig) and other resources from standard locations (e.g., UCSC, Ensembl) can be discovered. The resource includes metadata about each resource, e.g., a textual description, tags, and date of modification. The client creates and manages a local cache of files retrieved by the user, helping with quick and reproducible access.
 aochelpers by Ella Kaye. Use with advent-of-code-website-template to create a website for Advent of Code solutions. Also includes functions for getting and reading in puzzle input.
 aperol by Ella Kaye, Kelly Bodwin, Collin Schwantes. This is a joke package, which generates praise using the praise package, then garbles it, as if being delivered by someone tipsy or drunk.
 artpack by Meghan Harris. Create data that displays generative art when mapped into a 'ggplot2' plot. Functionality includes specialized data frame creation for geometric shapes, tools that define artistic color palettes, tools for geometrically transforming data, and other miscellaneous tools that are helpful when using 'ggplot2' for generative art.
- arttools arttools by Danielle Navarro. A personal-use package for managing generative art workflows.
 ARUtools by David Hope, Steffi LaZerte. Parse Autonomous Recording Unit (ARU) data and for sub-sampling recordings. Extract Metadata from your recordings, select a subset of recordings for interpretation, and prepare files for processing on the 'WildTrax' <https://wildtrax.ca/> platform. Read and process metadata from recordings collected using the SongMeter and BAR-LT types of ARUs.
- asciify asciify by Danielle Navarro. Takes an arbitrary image as input and constructs an text-based approximation to the image using the imager package.
- ASICS ASICS by Gaëlle Lefort, Rémi Servien, Patrick Tardivel + 1 more. With a set of pure metabolite reference spectra, ASICS quantifies concentration of metabolites in a complex spectrum. The identification of metabolites is performed by fitting a mixture model to the spectra of the library with a sparse penalty. The method and its statistical properties are described in Tardivel et al. (2017) <doi:10.1007/s11306-017-1244-5>.
 auditor by Alicja Gosiewska, Przemyslaw Biecek, Hubert Baniecki + 1 more. Provides an easy to use unified interface for creating validation plots for any model. The 'auditor' helps to avoid repetitive work consisting of writing code needed to create residual plots. This visualizations allow to asses and compare the goodness of fit, performance, and similarity of models.
 avilistr by Jasmine Daly. Provides easy access to the 'AviList' Global Avian Checklist, the first unified global bird taxonomy that harmonizes previous differences between International Ornithological Committee ('IOC'), 'Clements', and 'BirdLife' checklists. This package contains the complete 'AviList' dataset as R data objects ready for ornithological research and analysis. For more details see 'AviList' Core Team (2025) <doi:10.2173/avilist.v2025>.
- aws.s3 aws.s3 by Thomas J. Leeper, Simon Urbanek. A simple client package for the Amazon Web Services ('AWS') Simple Storage Service ('S3') 'REST' 'API' <https://aws.amazon.com/s3/>.
 bakeoff by Alison Hill, Chester Ismay, Richard Iannone. Data about the bakers, challenges, and ratings for "The Great British Bake Off", from Wikipedia <https://en.wikipedia.org/wiki/The_Great_British_Bake_Off>.
 basepenguins by Ella Kaye, Heather Turner. From 'R' 4.5.0, the 'datasets' package includes the penguins and penguins_raw data sets popularised in the 'palmerpenguins' package. 'basepenguins' takes files that use the 'palmerpenguins' package and converts them to work with the versions from 'datasets' ('R' >= 4.5.0). It does this by removing calls to library(palmerpenguins) and making the necessary changes to column names. Additionally, it provides helper functions to define new files paths for saving the output and a directory of example files to experiment with.
- BayesCVI BayesCVI by Nathakhun Wiroonsri, Onthada Preedasawakul. Algorithms for computing and generating plots with and without error bars for Bayesian cluster validity index (BCVI) (O. Preedasawakul, and N. Wiroonsri, A Bayesian Cluster Validity Index, Computational Statistics & Data Analysis, 202, 108053, 2025. <doi:10.1016/j.csda.2024.108053>) based on several underlying cluster validity indexes (CVIs) including Calinski-Harabasz, Chou-Su-Lai, Davies-Bouldin, Dunn, Pakhira-Bandyopadhyay-Maulik, Point biserial correlation, the score function, Starczewski, and Wiroonsri indices for hard clustering, and Correlation Cluster Validity, the generalized C, HF, KWON, KWON2, Modified Pakhira-Bandyopadhyay-Maulik, Pakhira-Bandyopadhyay-Maulik, Tang, Wiroonsri-Preedasawakul, Wu-Li, and Xie-Beni indices for soft clustering. The package is compatible with K-means, fuzzy C means, EM clustering, and hierarchical clustering (single, average, and complete linkage). Though BCVI is compatible with any underlying existing CVIs, we recommend users to use either WI or WP as the underlying CVI.
 BayesERtools by Kenta Yoshida, François Mercier, Danielle Navarro + 1 more. Suite of tools that facilitate exposure-response analysis using Bayesian methods. The package provides a streamlined workflow for fitting types of models that are commonly used in exposure-response analysis - linear and Emax for continuous endpoints, logistic linear and logistic Emax for binary endpoints, as well as performing simulation and visualization. Learn more about the workflow at <https://genentech.github.io/BayesERbook/>.
 bayesrules by Mine Dogucu, Alicia Johnson, Miles Ott. Provides datasets and functions used for analysis and visualizations in the Bayes Rules! book (<https://www.bayesrulesbook.com>). The package contains a set of functions that summarize and plot Bayesian models from some conjugate families and another set of functions for evaluation of some Bayesian models.
- bcaquiferdata bcaquiferdata by Steffi LaZerte, Christine Bieber. Set of tools for processing BC Aquifer lithology and yield data.
- bcgwcat bcgwcat by Steffi LaZerte, Andarge Baye. Set of tools for working with groundwater chemstry data from the BC Government Environmental Monitoring System (EMS). Download EMS data and a) export for use in AquaChem, b) view water quality summaries, c) create piper and stiff plots.
- bcgwlreports bcgwlreports by Steffi LaZerte, Jon Goetz. Fetch data, calculate historical percentiles and create reports of BC groundwater levels for set dates.
- BiocFileCache BiocFileCache by Lori Shepherd, Martin Morgan. This package creates a persistent on-disk cache of files that the user can add, update, and retrieve. It is useful for managing resources (such as custom Txdb objects) that are costly or difficult to create, web resources, and data files used across sessions.
- biwt biwt by Jo Hardin <jo.hardin@pomona.edu>, Jo Hardin. Compute multivariate location, scale, and correlation estimates based on Tukey's biweight M-estimator.
- BLModel BLModel by Andrzej Palczewski, Jan Palczewski. Posterior distribution in the Black-Litterman model is computed from a prior distribution given in the form of a time series of asset returns and a continuous distribution of views provided by the user as an external function.
 blogdown by Yihui Xie, Christophe Dervieux, Alison Presmanes Hill + 1 more. Write blog posts and web pages in R Markdown. This package supports the static site generator 'Hugo' (<https://gohugo.io>) best, and it also supports 'Jekyll' (<https://jekyllrb.com>) and 'Hexo' (<https://hexo.io>).
- BlueCarbon BlueCarbon by Valentina Costa. The BlueCarbon package is a collection of functions with the main focus to help "blue carbon" scientists.
- bootLong bootLong by Jeganathan Pratheepa, Holmes, Susan. This implements the block bootstrap method, subsampling method for choosing optimal block length, and exploratory tools such as correlogram, lag-plot, variogram for longitudinal count data.
- BradleyTerry2 BradleyTerry2 by Heather Turner, David Firth. Specify and fit the Bradley-Terry model, including structured versions in which the parameters are related to explanatory variables through a linear predictor and versions with contest-specific effects, such as a home advantage.
- BradleyTerryScalable BradleyTerryScalable by Ella Kaye, David Firth. Facilities are provided for fitting the simple, unstructured Bradley-Terry model to networks of binary comparisons. The implemented methods are designed to scale well to large, potentially sparse, networks. A fairly high degree of scalability is achieved through the use of EM and MM algorithms, which are relatively undemanding in terms of memory usage (relative to some other commonly used methods such as iterative weighted least squares, for example). Both maximum likelihood and Bayesian MAP estimation methods are implemented. The package provides various standard methods for a newly defined 'btfit' model class, such as the extraction and summarisation of model parameters and the simulation of new datasets from a fitted model. Tools are also provided for reshaping data into the newly defined "btdata" class, and for analysing the comparison network, prior to fitting the Bradley-Terry model. This package complements, rather than replaces, the existing 'BradleyTerry2' package. (BradleyTerry2 has rather different aims, which are mainly the specification and fitting of "structured" Bradley-Terry models in which the strength parameters depend on covariates.)
- bs4cards bs4cards by Danielle Navarro. Allows the user to generate bootstrap cards within R markdown documents. Intended for use in conjunction with R markdown HTML outputs and other formats that support the bootstrap 4 library.
- bundle bundle by Julia Silge, Simon Couch, Qiushi Yan + 2 more. Typically, models in 'R' exist in memory and can be saved via regular 'R' serialization. However, some models store information in locations that cannot be saved using 'R' serialization alone. The goal of 'bundle' is to provide a common interface to capture this information, situate it within a portable object, and restore it for use in new settings.
 butcher by Joyce Cahoon, Davis Vaughan, Max Kuhn + 3 more. Provides a set of S3 generics to axe components of fitted model objects and help reduce the size of model objects saved to disk.
 canvasXpress by Isaac Neuhaus, Connie Brett. Enables creation of visualizations using the CanvasXpress framework in R. CanvasXpress is a standalone JavaScript library for reproducible research with complete tracking of data and end-user modifications stored in a single PNG image that can be played back. See <https://www.canvasxpress.org> for more information.
- capesData capesData by Leonardo Biazoli, Mine Çetinkaya-Rundel, Eric Fernandes de Mello Araujo + 1 more. Information on activities to promote scholarships in Brazil and abroad for international mobility programs, recorded in Capes' computerized payment systems. The CAPES database refers to international mobility programs for the period from 2010 to 2019 <https://dadosabertos.capes.gov.br/dataset/>.
- casteval casteval by Daniel Yu, Irena Papst, David Champredon. A generalized, modular set of tools to facilitate the scoring and comparing of time series forecasts.
 cellranger by Jennifer Bryan. Helper functions to work with spreadsheets and the "A1:D10" style of cell range specification.
 censored by Emil Hvitfeldt, Hannah Frick, Posit Software. Engines for survival models from the 'parsnip' package. These include parametric models (e.g., Jackson (2016) <doi:10.18637/jss.v070.i08>), semi-parametric (e.g., Simon et al (2011) <doi:10.18637/jss.v039.i05>), and tree-based models (e.g., Buehlmann and Hothorn (2007) <doi:10.1214/07-STS242>).
- cereal cereal by Julia Silge, Davis Vaughan, Posit Software. The 'vctrs' package provides a concept of vector prototype that can be especially useful when deploying models and code. Serialize these object prototypes to 'JSON' so they can be used to check and coerce data in production systems, and deserialize 'JSON' back to the correct object prototypes.
- changepoint changepoint by Rebecca Killick. Implements various mainstream and specialised changepoint methods for finding single and multiple changepoints within data. Many popular non-parametric and frequentist methods are included. The cpt.mean(), cpt.var(), cpt.meanvar() functions should be your first point of call.
- chartkickR chartkickR by Bilikisu Olatunji. This is an implementation of the Chartkick.js library in R using the htmlwidgets framework.
 cherryblossom by Mine Çetinkaya-Rundel. Race results of the Cherry Blossom Run, which is an annual road race that takes place in Washington, DC.
- clinPK clinPK by Ron Keizer, Jasmine Hughes, Dominic Tong + 1 more. Provides equations commonly used in clinical pharmacokinetics and clinical pharmacology, such as equations for dose individualization, compartmental pharmacokinetics, drug exposure, anthropomorphic calculations, clinical chemistry, and conversion of common clinical parameters. Where possible and relevant, it provides multiple published and peer-reviewed equations within the respective R function.
- codemeta codemeta by Carl Boettiger, Maëlle Salmon. The 'Codemeta' Project defines a 'JSON-LD' format for describing software metadata, as detailed at <https://codemeta.github.io>. This package provides core utilities to generate this metadata with a minimum of dependencies.
 codemetar by Carl Boettiger, Maëlle Salmon. The 'Codemeta' Project defines a 'JSON-LD' format for describing software metadata, as detailed at <https://codemeta.github.io>. This package provides utilities to generate, parse, and modify 'codemeta.json' files automatically for R packages, as well as tools and examples for working with 'codemeta.json' 'JSON-LD' more generally.
- colorhex colorhex by Athanasia Mo Mowinckel. The website <https://www.color-hex.com> is a great resource of hex colour codes and palettes. This package allows you to retrieve palettes and colour information from the website directly from R. There are also custom scale-functions for 'ggplot2'.
 connectapi by Kara Woo, Toph Allen, Neal Richardson + 3 more. Provides a helpful 'R6' class and methods for interacting with the 'Posit Connect' Server API along with some meaningful utility functions for regular tasks. API documentation varies by 'Posit Connect' installation and version, but the latest documentation is also hosted publicly at <https://docs.posit.co/connect/api/>.
- coseq coseq by Andrea Rau. Co-expression analysis for expression profiles arising from high-throughput sequencing data. Feature (e.g., gene) profiles are clustered using adapted transformations and mixture models or a K-means algorithm, and model selection criteria (to choose an appropriate number of clusters) are provided.
- covid19france covid19france by Amanda Dobbyn. Imports and cleans 'opencovid19-fr' <https://github.com/opencovid19-fr/data> data on COVID-19 in France.
- covid19tunisia covid19tunisia by Mouna Belaid. Data personnally collected about the spread of COVID-19 (SARS-COV-2) in Tunisia.
- covid19us covid19us by Amanda Dobbyn. A wrapper around the 'COVID Tracking Project API' <https://covidtracking.com/api/> providing data on cases of COVID-19 in the US.
- cowsay cowsay by Scott Chamberlain, Amanda Dobbyn. Allows printing of character strings as messages/warnings/etc. with ASCII animals, including cats, cows, frogs, chickens, ghosts, and more.
- cransays cransays by Hugo Gruson, Maëlle Salmon, Stephanie Locke + 2 more. It scrapes the CRAN incoming FTP folder to find where each submission is.
- cstime cstime by Chi Zhang, Richard Aubrey White. Provides easy and consistent time conversion for public health purposes. The time conversion functions provided here are between date, ISO week, ISO yearweek, ISO year, calendar month/year, season, season week.
 cubble by H. Sherry Zhang, Dianne Cook, Ursula Laa + 2 more. A spatiotemperal data object in a relational data structure to separate the recording of time variant/ invariant variables. See the Journal of Statistical Software reference: <doi:10.18637/jss.v110.i07>.
- cvAUC cvAUC by Erin LeDell, Maya Petersen, Mark van der Laan. Tools for working with and evaluating cross-validated area under the ROC curve (AUC) estimators. The primary functions of the package are ci.cvAUC and ci.pooled.cvAUC, which report cross-validated AUC and compute confidence intervals for cross-validated AUC estimates based on influence curves for i.i.d. and pooled repeated measures data, respectively. One benefit to using influence curve based confidence intervals is that they require much less computation time than bootstrapping methods. The utility functions, AUC and cvAUC, are simple wrappers for functions from the ROCR package.
- CyTOFpower CyTOFpower by Anne-Maud Ferreira, Catherine Blish, Susan Holmes. This package is a tool to predict the power of CyTOF experiments in the context of differential state analyses. The package provides a shiny app with two options to predict the power of an experiment: i. generation of in-sicilico CyTOF data, using users input ii. browsing in a grid of parameters for which the power was already precomputed.
- dada2 dada2 by Benjamin Callahan <benjamin.j.callahan@gmail.com>, Paul McMurdie, Susan Holmes. The dada2 package infers exact amplicon sequence variants (ASVs) from high-throughput amplicon sequencing data, replacing the coarser and less accurate OTU clustering approach. The dada2 pipeline takes as input demultiplexed fastq files, and outputs the sequence variants and their sample-wise abundances after removing substitution and chimera errors. Taxonomic classification is available via a native implementation of the RDP naive Bayesian classifier, and species-level assignment to 16S rRNA gene fragments by exact matching.
 dados by Riva Quiroga, Sara Mortara, Beatriz Milz + 7 more. Este pacote traduz os seguintes conjuntos de dados: 'airlines', 'airports', 'ames_raw', 'AwardsManagers', 'babynames', 'Batting', 'diamonds', 'faithful', 'fueleconomy', 'Fielding', 'flights', 'gapminder', 'gss_cat', 'iris', 'Managers', 'mpg', 'mtcars', 'atmos', 'penguins', 'People, 'Pitching', 'pixarfilms','planes', 'presidential', 'table1', 'table2', 'table3', 'table4a', 'table4b', 'table5', 'vehicles', 'weather', 'who'. English: It provides a Portuguese translated version of the datasets listed above.
 DALEXtra by Szymon Maksymiuk, Przemyslaw Biecek, Hubert Baniecki. Provides wrapper of various machine learning models. In applied machine learning, there is a strong belief that we need to strike a balance between interpretability and accuracy. However, in field of the interpretable machine learning, there are more and more new ideas for explaining black-box models, that are implemented in 'R'. 'DALEXtra' creates 'DALEX' Biecek (2018) <doi:10.48550/arXiv.1806.08915> explainer for many type of models including those created using 'python' 'scikit-learn' and 'keras' libraries, and 'java' 'h2o' library. Important part of the package is Champion-Challenger analysis and innovative approach to model performance across subsets of test data presented in Funnel Plot.
- datalegreyar datalegreyar by Emi Tanaka. Datalegreya is a typeface which can interweave data curves with text. This package allows easy insertion of datalegreya font for html output such as Rmarkdown, xaringan, ioslides and shiny app.
 dataMaid by Anne Helby Petersen, Claus Thorn Ekstrøm. Data screening is an important first step of any statistical analysis. dataMaid auto generates a customizable data report with a thorough summary of the checks and the results that a human can use to identify possible errors. It provides an extendable suite of test for common potential errors in a dataset.
 datasauRus by Colin Gillespie, Steph Locke, Rhian Davies + 1 more. The Datasaurus Dozen is a set of datasets with the same summary statistics. They retain the same summary statistics despite having radically different distributions. The datasets represent a larger and quirkier object lesson that is typically taught via Anscombe's Quartet (available in the 'datasets' package). Anscombe's Quartet contains four very different distributions with the same summary statistics and as such highlights the value of visualisation in understanding data, over and above summary statistics. As well as being an engaging variant on the Quartet, the data is generated in a novel way. The simulated annealing process used to derive datasets from the original Datasaurus is detailed in "Same Stats, Different Graphs: Generating Datasets with Varied Appearance and Identical Statistics through Simulated Annealing" <doi:10.1145/3025453.3025912>.
- dataspice dataspice by Carl Boettiger, Scott Chamberlain, Auriel Fournier + 6 more. The goal of 'dataspice' is to make it easier for researchers to create basic, lightweight, and concise metadata files for their datasets. These basic files can then be used to make useful information available during analysis, create a helpful dataset "README" webpage, and produce more complex metadata formats to aid dataset discovery. Metadata fields are based on the 'Schema.org' and 'Ecological Metadata Language' standards.
 datelife by Brian O'Meara, Jonathan Eastman, Tracy Heath + 9 more. Methods and workflows to get chronograms (i.e., phylogenetic trees with branch lengths proportional to time), using open, peer-reviewed, state-of-the-art scientific data on time of lineage divergence. This package constitutes the main underlying code of the DateLife web service at <https://www.datelife.org>. To obtain a single summary chronogram from a group of relevant chronograms, we implement the Super Distance Matrix (SDM) method described in Criscuolo et al. (2006) <doi:10.1080/10635150600969872>. To find the grove of chronograms with a sufficiently overlapping set of taxa for summarizing, we implement theorem 1.1. from Ané et al. (2009) <doi:10.1007/s00026-009-0017-x>. A given phylogenetic tree can be dated using time of lineage divergence data as secondary calibrations (with caution, see Schenk (2016) <doi:10.1371/journal.pone.0148228>). To obtain and apply secondary calibrations, the package implements the congruification method described in Eastman et al. (2013) <doi:10.1111/2041-210X.12051>. Tree dating can be performed with different methods including BLADJ (Webb et al. (2008) <doi:10.1093/bioinformatics/btn358>), PATHd8 (Britton et al. (2007) <doi:10.1080/10635150701613783>), mrBayes (Huelsenbeck and Ronquist (2001) <doi:10.1093/bioinformatics/17.8.754>), and treePL (Smith and O'Meara (2012) <doi:10.1093/bioinformatics/bts492>).
 datos by Riva Quiroga, Edgar Ruiz, Mauricio Vargas + 1 more. Provee una versión traducida de los siguientes conjuntos de datos: 'airlines', 'airports', 'AwardsManagers', 'babynames', 'Batting', 'credit_data', 'diamonds', 'faithful', 'fueleconomy', 'Fielding', 'flights', 'gapminder', 'gss_cat', 'iris', 'Managers', 'mpg', 'mtcars', 'atmos', 'palmerpenguins', 'People, 'Pitching', 'planes', 'presidential', 'table1', 'table2', 'table3', 'table4a', 'table4b', 'table5', 'vehicles', 'weather', 'who'. English: It provides a Spanish translated version of the datasets listed above.
 devtools by Hadley Wickham, Jim Hester, Winston Chang + 2 more. Collection of package development tools.
 dials by Max Kuhn, Hannah Frick, Posit Software. Many models contain tuning parameters (i.e. parameters that cannot be directly estimated from the data). These tools can be used to define objects for creating, simulating, or validating values for such parameters.
- distory distory by John Chakerian, Susan Holmes, Emmanuel Paradis. Geodesic distance between phylogenetic trees and associated functions. The theoretical background of 'distory' is published in Billera et al. (2001) "Geometry of the space of phylogenetic trees." <doi:10.1006/aama.2001.0759>.
- dmrseq dmrseq by Keegan Korthauer, Rafael Irizarry, Yuval Benjamini + 1 more. This package implements an approach for scanning the genome to detect and perform accurate inference on differentially methylated regions from Whole Genome Bisulfite Sequencing data. The method is based on comparing detected regions to a pooled null distribution, that can be implemented even when as few as two samples per population are available. Region-level statistics are obtained by fitting a generalized least squares (GLS) regression model with a nested autoregressive correlated error structure for the effect of interest on transformed methylation proportions.
- dobtools dobtools by Amanda Dobbyn. A smattering of analysis helpers to improve reproducibility.
 dySEM by John Sakaluk, Omar Camanto. Scripting of structural equation models via 'lavaan' for Dyadic Data Analysis, and helper functions for supplemental calculations, tabling, and model visualization.
- ebdbNet ebdbNet by Andrea Rau. Infer the adjacency matrix of a network from time course data using an empirical Bayes estimation procedure based on Dynamic Bayesian Networks.
 ech by Gabriela Mathieu, Richard Detomasi. A consistent tool for downloading ECH data, processing them and generating new indicators: poverty, education, employment, etc. All data are downloaded from the official site of the National Institute of Statistics at <https://www.gub.uy/instituto-nacional-estadistica/datos-y-estadisticas/encuestas/encuesta-continua-hogares>.
 edibble by Emi Tanaka. A system to facilitate designing comparative (and non-comparative) experiments using the grammar of experimental designs <https://emitanaka.org/edibble-book/>. An experimental design is treated as an intermediate, mutable object that is built progressively by fundamental experimental components like units, treatments, and their relation. The system aids in experimental planning, management and workflow.
 emmeans by Russell V. Lenth, Julia Piaskowski. Obtain estimated marginal means (EMMs) for many linear, generalized linear, and mixed models. Compute contrasts or linear functions of EMMs, trends, and comparisons of slopes. Plots and other displays. Least-squares means are discussed, and the term "estimated marginal means" is suggested, in Searle, Speed, and Milliken (1980) Population marginal means in the linear model: An alternative to least squares means, The American Statistician 34(4), 216-221 <doi:10.1080/00031305.1980.10483031>.
 emodnet.wfs by Joana Beja, Anna Krystalli, Salvador Fernández-Bejarano + 1 more. Access and interrogate 'EMODnet' (European Marine Observation and Data Network) Web Feature Service data <https://emodnet.ec.europa.eu/en/emodnet-web-service-documentation#data-download-services>. This includes listing existing data sources, and getting data from each of them.
- EPACmodel EPACmodel by Irena Papst, Michael WZ Li. Simulate versions of the EPAC model.
- EpiGenR EpiGenR by Lucy M Li. This package contains functions to simulate epidemic data, parse existing data, generate input files for the EpiGenMCMC (github.com/lucymli/EpiGenMCMC) C++ program, and visualise output from EpiGenMCMC.
- ern ern by David Champredon, Warsame Yusuf, Irena Papst. Estimate the effective reproduction number from wastewater and clinical data sources.
 escrocR by Hilaire Drouineau, Marine Ballutaud, Jeremy Lobry. Escroc is a model that aims at estimating contaminant biomagnification, isotopic enrichments and diet in trophic networks.
- ESPA ESPA by Jeganathan Pratheepa, Trindade, Alex. This implements the empirical saddlepoint approximation based method for producing a smooth survival function, density function for right-censored data.
- ExperimentHub ExperimentHub by Bioconductor Package Maintainer, Martin Morgan, Lori Shepherd. This package provides a client for the Bioconductor ExperimentHub web resource. ExperimentHub provides a central location where curated data from experiments, publications or training courses can be accessed. Each resource has associated metadata, tags and date of modification. The client creates and manages a local cache of files retrieved enabling quick and reproducible access.
- EZtune EZtune by Jill Lundell. Contains two functions that are intended to make tuning supervised learning methods easy. The eztune function uses a genetic algorithm or Hooke-Jeeves optimizer to find the best set of tuning parameters. The user can choose the optimizer, the learning method, and if optimization will be based on accuracy obtained through validation error, cross validation, or resubstitution. The function eztune_cv will compute a cross validated error rate. The purpose of eztune_cv is to provide a cross validated accuracy or MSE when resubstitution or validation data are used for optimization because error measures from both approaches can be misleading.
- FactoMineR FactoMineR by Francois Husson, Julie Josse, Sebastien Le + 1 more. Exploratory data analysis methods to summarize, visualize and describe datasets. The main principal component methods are available, those with the largest potential in terms of applications: principal component analysis (PCA) when variables are quantitative, correspondence analysis (CA) and multiple correspondence analysis (MCA) when variables are categorical, Multiple Factor Analysis when variables are structured in groups, etc. and hierarchical cluster analysis. F. Husson, S. Le and J. Pages (2017).
 ferrn by H. Sherry Zhang, Dianne Cook, Ursula Laa + 2 more. Diagnostic plots for optimisation, with a focus on projection pursuit. These show paths the optimiser takes in the high-dimensional space in multiple ways: by reducing the dimension using principal component analysis, and also using the tour to show the path on the high-dimensional space. Several botanical colour palettes are included, reflecting the name of the package. A paper describing the methodology can be found at <https://journal.r-project.org/articles/RJ-2021-105/index.html>.
- flametree flametree by Danielle Navarro. A generative art system for producing tree-like images using an L-system to create the structures. The package includes tools for generating the data structures and visualise them in a variety of styles.
 forested by Grayson White, Hannah Frick, Simon Couch + 1 more. A small subset of plots throughout the U.S. are sampled and assessed "on-the-ground" as forested or non-forested by the U.S. Department of Agriculture, Forest Service, Forest Inventory and Analysis (FIA) Program, but the FIA also has access to remotely sensed data for all land in the country. The 'forested' package contains data frames intended for use in predictive modeling applications where the more easily-accessible remotely sensed data can be used to predict whether a plot is forested or non-forested. Currently, the package provides data for Washington and Georgia.
- forwards forwards by Heather Turner, Oliver Keyes. Anonymized data from surveys conducted by Forwards <https://forwards.github.io/>, the R Foundation task force on women and other under-represented groups. Currently, a single data set of responses to a survey of attendees at useR! 2016 <https://www.r-project.org/useR-2016/>, the R user conference held at Stanford University, Stanford, California, USA, June 27 - June 30 2016.
- gapminder gapminder by Jennifer Bryan. An excerpt of the data available at Gapminder.org. For each of 142 countries, the package provides values for life expectancy, GDP per capita, and population, every five years, from 1952 to 2007.
- gargle gargle by Jennifer Bryan, Craig Citro, Hadley Wickham + 1 more. Provides utilities for working with Google APIs <https://developers.google.com/apis-explorer>. This includes functions and classes for handling common credential types and for preparing, executing, and processing HTTP requests.
- GenBank GenBank by Lucy M Li, Who to complain to. Interfaces with e-utilities on the NCBI website to download sequence data from the Nucleotide database on GenBank.
 geomnet by Sam Tyner, Heike Hofmann. Network visualization in the 'ggplot2' framework. Network functionality is provided in a single 'ggplot2' layer by calling the geom 'net'. Layouts are calculated using the 'sna' package, example networks are included.
 ggauto by Nicola Rennie. Automatically choose an appropriate chart type based on the types and values in the data. Apply more accessible default styling and colours to 'ggplot2' charts.
 ggflowchart by Nicola Rennie. Flowcharts can be a useful way to visualise complex processes. This package uses the layered grammar of graphics of 'ggplot2' to create simple flowcharts.
 ggplot2 by Hadley Wickham, Winston Chang, Lionel Henry + 8 more. A system for 'declaratively' creating graphics, based on "The Grammar of Graphics". You provide the data, tell 'ggplot2' how to map variables to aesthetics, what graphical primitives to use, and it takes care of the details.
 ggPMX by Amine Gassem, Bruno Bieth, Irina Baltcheva + 10 more. At Novartis, we aimed at standardizing the set of diagnostic plots used for modeling activities in order to reduce the overall effort required for generating such plots. For this, we developed a guidance that proposes an adequate set of diagnostics and a toolbox, called 'ggPMX' to execute them. 'ggPMX' is a toolbox that can generate all diagnostic plots at a quality sufficient for publication and submissions using few lines of code. This package focuses on plots recommended by ISoP <doi:10.1002/psp4.12161>. While not required, you can get/install the 'R' 'lixoftConnectors' package in the 'Monolix' installation, as described at the following url <https://monolixsuite.slp-software.com/r-functions/2024R1/installation-and-initialization>. When 'lixoftConnectors' is available, 'R' can use 'Monolix' directly to create the required Chart Data instead of exporting it from the 'Monolix' gui.
 ggseg.extra by Athanasia Mo Mowinckel. Create brain atlas data sets compatible with the 'ggsegverse' plotting packages in 'R'. Provides pipelines for building cortical, subcortical, and white-matter tract atlases from 'FreeSurfer' annotation files, 'GIFTI' and 'CIFTI' surface formats, 'neuromaps', and volumetric 'NIfTI' images.
- ggseg.formats ggseg.formats by Athanasia Mo Mowinckel, Center for Lifespan Changes in Brain and Cognition. Provides the 'ggseg_atlas' S3 class used across the 'ggseg' ecosystem for 2D and 3D brain visualisation. Ships three bundled atlases ('Desikan-Killiany', 'FreeSurfer' 'aseg', 'TRACULA') and functions for querying, subsetting, renaming, and enriching atlas objects. Also includes readers for 'FreeSurfer' statistics files.
 ggseg by Athanasia Mo Mowinckel, Didac Vidal-Piñeiro, Ramiro Magno + 2 more. Provides a 'ggplot2' geom and position for visualizing brain region data on cortical, subcortical, and white matter tract atlases. Brain atlas geometries are stored as simple features ('sf'), enabling seamless integration with the 'ggplot2' ecosystem including faceting, custom scales, and themes. Mowinckel & Vidal-Piñeiro (2020) <doi:10.1177/2515245920928009>.
 ggseg.meshes by Athanasia Mo Mowinckel, Center for Lifespan Changes in Brain and Cognition. Provides additional brain surface meshes for cortical and cerebellar visualisation in the 'ggsegverse' ecosystem. Cortical surfaces include pial, white, midthickness, semi-inflated, sphere, smoothwm, and orig at fsaverage5 resolution. Cerebellar surfaces include the Spatially Unbiased Infratentorial Template (SUIT) flatmap. All meshes follow the same vertices/faces data frame format used by 'ggseg.formats' and 'ggseg3d'.
 ggseg3d by Athanasia Mo Mowinckel, Didac Vidal-Piñeiro, Center for Lifespan Changes in Brain and Cognition. Plot brain atlases as interactive 3D meshes using 'Three.js' via 'htmlwidgets', or render publication-quality static images through 'rgl' and 'rayshader'. A pipe-friendly API lets you map data onto brain regions, control camera angles, toggle region edges, overlay glass brains, and snapshot or ray-trace the result. Additional atlases are available through the 'ggsegverse' r-universe. Mowinckel & Vidal-Piñeiro (2020) <doi:10.1177/2515245920928009>.
 ghclass by Colin Rundel, Mine Cetinkaya-Rundel. Interface for the GitHub API that enables efficient management of courses on GitHub. It has a functionality for managing organizations, teams, repositories, and users on GitHub and helps automate most of the tedious and repetitive tasks around creating and distributing assignments.
- GISINTEGRATION GISINTEGRATION by Hossein Hassani, Leila Marvian Mashhad, Sara Stewart + 1 more. Designed to facilitate the preprocessing and linking of GIS (Geographic Information System) databases <https://www.sciencedirect.com/topics/computer-science/gis-database>, the R package 'GISINTEGRATION' offers a robust solution for efficiently preparing GIS data for advanced spatial analyses. This package excels in simplifying intrica procedures like data cleaning, normalization, and format conversion, ensuring that the data are optimally primed for precise and thorough analysis.
 glitter by Lise Vaudor, Maëlle Salmon. This package aims at writing and sending SPARQL queries. It makes the exploration and use of Linked Open Data (Wikidata in particular) easier for those who do not know SPARQL.
 glue by Jim Hester, Jennifer Bryan, Posit Software. An implementation of interpreted string literals, inspired by Python's Literal String Interpolation <https://www.python.org/dev/peps/pep-0498/> and Docstrings <https://www.python.org/dev/peps/pep-0257/> and Julia's Triple-Quoted String Literals <https://docs.julialang.org/en/v1.3/manual/strings/#Triple-Quoted-String-Literals-1>.
- gmailr gmailr by Jim Hester, Jennifer Bryan, Posit Software. An interface to the 'Gmail' 'RESTful' API. Allows access to your 'Gmail' messages, threads, drafts and labels.
- gnm gnm by Heather Turner, David Firth. Functions to specify and fit generalized nonlinear models, including models with multiplicative interaction terms such as the UNIDIFF model from sociology and the AMMI model from crop science, and many others. Over-parameterized representations of models are used throughout; functions are provided for inference on estimable parameter combinations, as well as standard methods for diagnostics etc.
 gnomesims by Josefina Bernardo. The package simulates genotyped family data of parents and offspring pairs. Simulated data may include gene-environment covariance. The package also calculates the power of finding cultural transmission and sibling interaction in the data using different models.
 goodpractice by Mark Padgham, Karina Marks, Daniel de Bortoli + 4 more. Give advice about good practices when building R packages. Advice includes functions and syntax to avoid, package structure, code complexity, code formatting, etc.
 googleAnalyticsR by Mark Edmondson, Erik Grönroos. Interact with the Google Analytics APIs <https://developers.google.com/analytics/>, including the Core Reporting API (v3 and v4), Management API, User Activity API GA4's Data API and Admin API and Multi-Channel Funnel API.
 googledrive by Lucy D'Agostino McGowan, Jennifer Bryan, Posit Software. Manage Google Drive files from R.
 googlesheets4 by Jennifer Bryan, Posit Software. Interact with Google Sheets through the Sheets API v4 <https://developers.google.com/sheets/api>. "API" is an acronym for "application programming interface"; the Sheets API allows users to interact with Google Sheets programmatically, instead of via a web browser. The "v4" refers to the fact that the Sheets API is currently at version 4. This package can read and write both the metadata and the cell data in a Sheet.
 gtreg by Shannon Pileggi, Daniel D. Sjoberg. Creates tables suitable for regulatory agency submission by leveraging the 'gtsummary' package as the back end. Tables can be exported to HTML, Word, PDF and more. Highly customized outputs are available by utilizing existing styling functions from 'gtsummary' as well as custom options designed for regulatory tables.
 gtsummary by Daniel D. Sjoberg, Joseph Larmarange, Michael Curry + 4 more. Creates presentation-ready tables summarizing data sets, regression models, and more. The code to create the tables is concise and highly customizable. Data frames can be summarized with any function, e.g. mean(), median(), even user-written functions. Regression models are summarized and include the reference rows for categorical variables. Common regression models, such as logistic regression and Cox proportional hazards regression, are automatically identified and the tables are pre-filled with appropriate column headers.
- GWASTools GWASTools by Stephanie M. Gogarten, Cathy Laurie, Tushar Bhangale + 12 more. Classes for storing very large GWAS data sets and annotation, and functions for GWAS data cleaning and analysis.
- h2o h2o by Tomas Fryda, Erin LeDell, Navdeep Gill + 11 more. R interface for 'H2O', the scalable open source machine learning platform that offers parallelized implementations of many supervised and unsupervised machine learning algorithms such as Generalized Linear Models (GLM), Gradient Boosting Machines (including XGBoost), Random Forests, Deep Neural Networks (Deep Learning), Stacked Ensembles, Naive Bayes, Generalized Additive Models (GAM), ANOVA GLM, Cox Proportional Hazards, K-Means, PCA, ModelSelection, Word2Vec, as well as a fully automatic machine learning algorithm (H2O AutoML).
- h2o4gpu h2o4gpu by Yuan Tang, Navdeep Gill, Erin LeDell + 1 more. Interface to 'H2O4GPU' <https://github.com/h2oai/h2o4gpu>, a collection of 'GPU' solvers for machine learning algorithms.
- Haplin Haplin by Hakon K. Gjessing. Performs genetic association analyses of case-parent triad (trio) data with multiple markers. It can also incorporate complete or incomplete control triads, for instance independent control children. Estimation is based on haplotypes, for instance SNP haplotypes, even though phase is not known from the genetic data. 'Haplin' estimates relative risk (RR + conf.int.) and p-value associated with each haplotype. It uses maximum likelihood estimation to make optimal use of data from triads with missing genotypic data, for instance if some SNPs has not been typed for some individuals. 'Haplin' also allows estimation of effects of maternal haplotypes and parent-of-origin effects, particularly appropriate in perinatal epidemiology. 'Haplin' allows special models, like X-inactivation, to be fitted on the X-chromosome. A GxE analysis allows testing interactions between environment and all estimated genetic effects. The models were originally described in "Gjessing HK and Lie RT. Case-parent triads: Estimating single- and double-dose effects of fetal and maternal disease gene haplotypes. Annals of Human Genetics (2006) 70, pp. 382-396".
- HaplinMethyl HaplinMethyl by Julia Romanowska, Haakon K. Gjessing. Reading in and handling of large environmental data matrices that are used in Haplin analyses, e.g., gene-environment interactions.
 hardhat by Hannah Frick, Davis Vaughan, Max Kuhn + 1 more. Building modeling packages is hard. A large amount of effort generally goes into providing an implementation for a new method that is efficient, fast, and correct, but often less emphasis is put on the user interface. A good interface requires specialized knowledge about S3 methods and formulas, which the average package developer might not have. The goal of 'hardhat' is to reduce the burden around building new modeling packages by providing functionality for preprocessing, predicting, and validating input.
- Hassani.SACF Hassani.SACF by Hossein Hassani, Masoud Yarmohammdi, Mohammad Reza Yeganegi + 1 more. The Ljung-Box test is one of the most important tests for time series diagnostics and model selection. The Hassani SACF (Sum of the Sample Autocorrelation Function) Theorem , however, indicates that the sum of sample autocorrelation function is always fix for any stationary time series with arbitrary length. This package confirms for sensitivity of the Ljung-Box test to the number of lags involved in the test and therefore it should be used with extra caution. The Hassani SACF Theorem has been described in : Hassani, Yeganegi and M. R. (2019) <doi:10.1016/j.physa.2018.12.028>.
- Hassani.Silva Hassani.Silva by Hossein Hassani, Emmanuel Sirimal Silva, Leila Marvian Mashhad. A non-parametric test founded upon the principles of the Kolmogorov-Smirnov (KS) test, referred to as the KS Predictive Accuracy (KSPA) test. The KSPA test is able to serve two distinct purposes. Initially, the test seeks to determine whether there exists a statistically significant difference between the distribution of forecast errors, and secondly it exploits the principles of stochastic dominance to determine whether the forecasts with the lower error also reports a stochastically smaller error than forecasts from a competing model, and thereby enables distinguishing between the predictive accuracy of forecasts. KSPA test has been described in : Hassani and Silva (2015) <doi:10.3390/econometrics3030590>.
 hellodatascience by Mine Dogucu, Catalina Medina, Alma Castro. Provides datasets used for analysis and visualizations in the open-access Hello Data Science book.
 hexify by Danielle Navarro. Allows the user to create hex stickers from images.
- hicream hicream by Elise Jorge, Sylvain Foissac, Toby Hocking + 2 more. Perform Hi-C data differential analysis based on pixel-level differential analysis and a post hoc inference strategy to quantify signal in clusters of pixels. Clusters of pixels are obtained through a connectivity-constrained two-dimensional hierarchical clustering.
- highriskzone highriskzone by Heidi Seibold, Monia Mahling, Sebastian Linne + 2 more. Functions for determining and evaluating high-risk zones and simulating and thinning point process data, as described in 'Determining high risk zones using point process methodology - Realization by building an R package' Seibold (2012) <http://highriskzone.r-forge.r-project.org/Bachelorarbeit.pdf> and 'Determining high-risk zones for unexploded World War II bombs by using point process methodology', Mahling et al. (2013) <doi:10.1111/j.1467-9876.2012.01055.x>.
 hmsidwR by Federica Gazzelloni. A collection of datasets and supporting functions accompanying Health Metrics and the Spread of Infectious Diseases by Federica Gazzelloni (2024). This package provides data for health metrics calculations, including Disability-Adjusted Life Years (DALYs), Years of Life Lost (YLLs), and Years Lived with Disability (YLDs), as well as additional tools for analyzing and visualizing health data. Federica Gazzelloni (2024) <doi:10.5281/zenodo.10818338>.
- HTSCluster HTSCluster by Andrea Rau, Gilles Celeux, Marie-Laure Martin-Magniette + 1 more. A Poisson mixture model is implemented to cluster genes from high- throughput transcriptome sequencing (RNA-seq) data. Parameter estimation is performed using either the EM or CEM algorithm, and the slope heuristics are used for model selection (i.e., to choose the number of clusters).
- HTSFilter HTSFilter by Andrea Rau. This package implements a filtering procedure for replicated transcriptome sequencing data based on a global Jaccard similarity index in order to identify genes with low, constant levels of expression across one or more experimental conditions.
- iAdapt iAdapt by Alyssa Vanderbeek. Simulate and implement early phase two-stage adaptive dose-finding design for binary and quasi-continuous toxicity endpoints. See Chiuzan et al. (2018) for further reading <DOI:10.1080/19466315.2018.1462727>.
 igraph by Gábor Csárdi, Tamás Nepusz, Vincent Traag + 6 more. Routines for simple graphs and network analysis. It can handle large graphs very well and provides functions for generating random and regular graphs, graph visualization, centrality methods and much more.
- implicitMeasures implicitMeasures by Ottavia M. Epifania. A tool for computing the scores for the Implicit Association Test (IAT; Greenwald, McGhee & Schwartz (1998) <doi:10.1037/0022-3514.74.6.1464>) and the Single Category-IAT (SC-IAT: Karpinski & Steinman (2006) <doi:10.1037/0022-3514.91.1.16>). Functions for preparing the data (both for the IAT and the SC-IAT), plotting the results, and obtaining a table with the scores of implicit measures descriptive statistics are provided.
 infer by Andrew Bray, Chester Ismay, Evgeni Chasnovski + 3 more. The objective of this package is to perform inference using an expressive statistical grammar that coheres with the tidy design framework.
- infiltrodiscR infiltrodiscR by Carolina V. Giraldo, Sara E. Acevedo, Carlos A. Bonilla. A set of functions for the modeling of data derived from the Minidisc Infiltrometer device. It calculates cumulative infiltration and square root of time. Also, it calculates the A parameter based on soil physical properties.
 janeaustenr by Julia Silge. Full texts for Jane Austen's 6 completed novels, ready for text analysis. These novels are "Sense and Sensibility", "Pride and Prejudice", "Mansfield Park", "Emma", "Northanger Abbey", and "Persuasion".
- jasmines jasmines by Danielle Navarro. It doesn't do much, really.
- jaysire jaysire by Danielle Navarro, Danielle Navarro. The jaysire package allows the user to build browser based behavioral experiments within R by providing an interface to the jsPsych javascript library.
- JTHelpers JTHelpers by Jennifer Thompson, Cole Beck, Zhiguo Zhao. A package of helper functions I and others wrote for my own frequent use. Several are related to Frank Harrell’s rms package.
- Kmisc Kmisc by Seo-young Silvia Kim. Assortment of functions that aid R programming.
- learnres learnres by Yanina Bellini Saibene. Contains templates and themeing files.
- levelup levelup by Rhian Davies. Tools for creating, analysing and reporting on CPD activities.
- LITAP LITAP by Steffi LaZerte, Sheng Li. Terrain analysis and landscape and hydrology models built on terrain attributes. A major component of LITAP is founded on R. A. (Bob) MacMillan's LandMapR suite of programs for flow topology and landform segmentation analyses with extended new parameters and methodologies, as well as with new calculations and uses of directional terrain attributes.
- lmmpar lmmpar by Fulya Gokalp Yavuz, Barret Schloerke. Embarrassingly Parallel Linear Mixed Model calculations spread across local cores which repeat until convergence.
- logmult logmult by Milan Bouchet-Valat. Functions to fit log-multiplicative models using 'gnm', with support for convenient printing, plots, and jackknife/bootstrap standard errors. For complex survey data, models can be fitted from design objects from the 'survey' package. Currently supported models include UNIDIFF (Erikson & Goldthorpe, 1992), a.k.a. log-multiplicative layer effect model (Xie, 1992) <doi:10.2307/2096242>, and several association models: Goodman (1979) <doi:10.2307/2286971> row-column association models of the RC(M) and RC(M)-L families with one or several dimensions; two skew-symmetric association models proposed by Yamaguchi (1990) <doi:10.2307/271086> and by van der Heijden & Mooijaart (1995) <doi:10.1177/0049124195024001002> Functions allow computing the intrinsic association coefficient (see Bouchet-Valat (2022) <doi:10.1177/0049124119852389>) and the Altham (1970) index <doi:10.1111/j.2517-6161.1970.tb00816.x>, including via the Bayes shrinkage estimator proposed by Zhou (2015) <doi:10.1177/0081175015570097>; and the RAS/IPF/Deming-Stephan algorithm.
- lsr lsr by Danielle Navarro. A collection of tools intended to make introductory statistics easier to teach, including wrappers for common hypothesis tests and basic data manipulation. It accompanies Navarro, D. J. (2015). Learning Statistics with R: A Tutorial for Psychology Students and Other Beginners, Version 0.6.
 lvm4net by Isabella Gollini. Latent variable models for network data using fast inferential procedures. For more information please visit: <http://igollini.github.io/lvm4net/>.
 meetupr by Athanasia Mo Mowinckel, Erin LeDell, Olga Mierzwa-Sulima + 2 more. Provides programmatic access to the 'Meetup' 'GraphQL' API (<https://www.meetup.com/graphql/>), enabling users to retrieve information about groups, events, and members from 'Meetup' (<https://www.meetup.com/>). Supports authentication via 'OAuth2' and includes functions for common queries and data manipulation tasks.
 memer by Sam Tyner, Haley Jeppson. A tidyverse-friendly package for generating memes in R. The functions are primarily wrappers around functions in the magick package.
 messy by Nicola Rennie. For the purposes of teaching, it is often desirable to show examples of working with messy data and how to clean it. This R package creates messy data from clean, tidy data frames so that students have a clean example to work towards.
- metaRNASeq metaRNASeq by Guillemette Marot, Andrea Rau, Florence Jaffrezic + 1 more. Implementation of two p-value combination techniques (inverse normal and Fisher methods). A vignette is provided to explain how to perform a meta-analysis from two independent RNA-seq experiments.
- methylCC methylCC by Stephanie C. Hicks, Rafael Irizarry. A tool to estimate the cell composition of DNA methylation whole blood sample measured on any platform technology (microarray and sequencing).
- Metrics Metrics by Ben Hamner, Michael Frasco. An implementation of evaluation metrics in R that are commonly used in supervised machine learning. It implements metrics for regression, time series, binary classification, classification, and information retrieval problems. It has zero dependencies and a consistent, simple interface for all functions.
 mice by Stef van Buuren, Karin Groothuis-Oudshoorn. Multiple imputation using Fully Conditional Specification (FCS) implemented by the MICE algorithm as described in Van Buuren and Groothuis-Oudshoorn (2011) <doi:10.18637/jss.v045.i03>. Each variable has its own imputation model. Built-in imputation models are provided for continuous data (predictive mean matching, normal), binary data (logistic regression), unordered categorical data (polytomous logistic regression) and ordered categorical data (proportional odds). MICE can also impute continuous two-level data (normal model, pan, second-level variables). Passive imputation can be used to maintain consistency between variables. Various diagnostic plots are available to inspect the quality of the imputations.
- missMDA missMDA by Francois Husson, Julie Josse. Imputation of incomplete continuous or categorical datasets; Missing values are imputed with a principal component analysis (PCA), a multiple correspondence analysis (MCA) model or a multiple factor analysis (MFA) model; Perform multiple imputation with and in PCA or MCA.
 mitey by Kylie Ainslie. Provides methods to estimate serial intervals and time-varying case reproduction numbers from infectious disease outbreak data. Serial intervals measure the time between symptom onset in linked transmission pairs, while case reproduction numbers quantify how many secondary cases each infected individual generates over time. These parameters are essential for understanding transmission dynamics, evaluating control measures, and informing public health responses. The package implements the maximum likelihood framework from Vink et al. (2014) <doi:10.1093/aje/kwu209> for serial interval estimation and the retrospective method from Wallinga & Lipsitch (2007) <doi:10.1098/rspb.2006.3754> for reproduction number estimation. Originally developed for scabies transmission analysis but applicable to other infectious diseases including influenza, COVID-19, and emerging pathogens. Designed for epidemiologists, public health researchers, and infectious disease modelers working with outbreak surveillance data.
- mixKernel mixKernel by Nathalie Vialaneix, Celine Brouard, Remi Flamary + 2 more. Kernel-based methods are powerful methods for integrating heterogeneous types of data. mixKernel aims at providing methods to combine kernel for unsupervised exploratory analysis. Different solutions are provided to compute a meta-kernel, in a consensus way or in a way that best preserves the original topology of the data. mixKernel also integrates kernel PCA to visualize similarities between samples in a non linear space and from the multiple source point of view <doi:10.1093/bioinformatics/btx682>. A method to select (as well as funtions to display) important variables is also provided <doi:10.1093/nargab/lqac014>.
 MLDataR by Gary Hutson, Asif Laldin, Isabella Velásquez. Contains a collection of datasets for working with machine learning tasks. It will contain datasets for supervised machine learning Jiang (2020)<doi:10.1016/j.beth.2020.05.002> and will include datasets for classification and regression. The aim of this package is to use data generated around health and other domains.
- mmaqshiny mmaqshiny by Adithi R. Upadhya, Meenakshi Kushwaha. Mobile-monitoring or sensors on a mobile platform, is an increasingly popular approach to measure high-resolution pollution data at the street level. Coupled with location data, spatial visualization of air-quality parameters helps detect localized areas of high air pollution, also called hotspots. In this approach, portable sensors are mounted on a vehicle and driven on predetermined routes to collect high frequency data (1 Hz). 'mmaqshiny' is for analysing, visualizing and spatial mapping of high-resolution air-quality data collected by specific devices installed on a moving platform. 1 Hz data of PM2.5 (mass concentrations of particulate matter with size less than 2.5 microns), Black carbon mass concentrations (BC), ultra-fine particle number concentrations, carbon dioxide along with GPS coordinates and relative humidity (RH) data collected by popular portable instruments (TSI DustTrak-8530, Aethlabs microAeth-AE51, TSI CPC3007, LICOR Li-830, Garmin GPSMAP 64s, Omega USB RH probe respectively). It incorporates device specific cleaning and correction algorithms. RH correction is applied to DustTrak PM2.5 following the Chakrabarti et al., (2004) <doi:10.1016/j.atmosenv.2004.03.007>. Provision is given to add linear regression coefficients for correcting the PM2.5 data (if required). BC data will be cleaned for the vibration generated noise, by adopting the statistical procedure as explained in Apte et al., (2011) <doi:10.1016/j.atmosenv.2011.05.028>, followed by a loading correction as suggested by Ban-Weiss et al., (2009) <doi:10.1021/es8021039>. For the number concentration data, provision is given for dilution correction factor (if a diluter is used with CPC3007; default value is 1). The package joins the raw, cleaned and corrected data from the above said instruments and outputs as a downloadable csv file.
- model4you model4you by Heidi Seibold, Achim Zeileis, Torsten Hothorn. Model-based trees for subgroup analyses in clinical trials and model-based forests for the estimation and prediction of personalised treatment effects (personalised models). Currently partitioning of linear models, lm(), generalised linear models, glm(), and Weibull models, survreg(), is supported. Advanced plotting functionality is supported for the trees and a test for parameter heterogeneity is provided for the personalised models. For details on model-based trees for subgroup analyses see Seibold, Zeileis and Hothorn (2016) <doi:10.1515/ijb-2015-0032>; for details on model-based forests for estimation of individual treatment effects see Seibold, Zeileis and Hothorn (2017) <doi:10.1177/0962280217693034>.
 modleR by Andrea Sánchez-Tapia, Sara Mortara, Diogo Rocha + 2 more. This package implements a workflow to perform ecological niche modeling (ENM), including some procedures of data preparation and cleaning, the setup of several experimental designs (crossvalidation, repeated crossvalidation and bootstrap), the application of inclusion and exclusion buffers to background selection, fitting algorithms that are already implemented in dismo, randomForest, e1071, kernlab packages, namely: Bioclim, Domain, GLM, Mahalanobis Distance, Maxent, Random Forest, and two versions of Support Vector Machines (here svmk and svme). It uses the structure provided by package dismo for model evaluation and projects the models into other sets of environmental variables. A function to join individual partitions in several ways is provided in final_model(). Finally, ensemble_model() assembles models from distinct algorithms and provides summary rasters.
- monochromeR monochromeR by Cara Thompson. Generate a monochrome palette from a starting colour for a specified number of colours. The package can also be used to display colour palettes in the plot window, with or without hex codes and colour labels.
- mortAAR mortAAR by Nils Mueller-Scheessel, Martin Hinz, Clemens Schmid + 7 more. A collection of functions for the analysis of archaeological mortality data (on the topic see e.g. Chamberlain 2006 <https://books.google.de/books?id=nG5FoO_becAC&lpg=PA27&ots=LG0b_xrx6O&dq=life%20table%20archaeology&pg=PA27#v=onepage&q&f=false>). It takes demographic data in different formats and displays the result in a standard life table as well as plots the relevant indices (percentage of deaths, survivorship, probability of death, life expectancy, percentage of population). It also checks for possible biases in the age structure and applies corrections to life tables.
 multilevelmod by Max Kuhn, Hannah Frick. Bindings for hierarchical regression models for use with the 'parsnip' package. Models include longitudinal generalized linear models (Liang and Zeger, 1986) <doi:10.1093/biomet/73.1.13>, and mixed-effect models (Pinheiro and Bates) <doi:10.1007/978-1-4419-0318-1_1>.
- namer namer by Colin Gillespie, Steph Locke, Maëlle Salmon. It names the 'R Markdown' chunks of files based on the filename.
- naturecounts naturecounts by Steffi LaZerte, Denis Lepage. Access and download data on plant and animal populations from various databases through NatureCounts, a service managed by Bird Studies Canada.
- nestr nestr by Emi Tanaka. Facilitates building a nesting or hierarchical structure as a list or data frame by using a human friendly syntax.
 nettskjemar by Athanasia Mo Mowinckel. Enables users to retrieve data, meta-data, and codebooks from <https://nettskjema.no/>. The data from the API is richer than from the online data portal. This package is not developed by the University of Oslo IT. Mowinckel (2021) <doi:10.5281/zenodo.4745481>.
 neuromapr by Athanasia Mo Mowinckel. Implements spatial null models and coordinate-space transformations for statistical comparison of brain maps, following the framework described in Markello et al. (2022) <doi:10.1038/s41592-022-01625-w>. Provides variogram-matching surrogates (Burt et al. 2020), Moran spectral randomization (Wagner & Dray 2015), and spin-based permutation tests (Alexander-Bloch et al. 2018). Includes an R interface to the 'neuromaps' annotation registry for browsing, downloading, and comparing brain map annotations from the Open Science Framework ('OSF'). Integrates with 'ciftiTools' for coordinate-space transforms.
- NiLeDAM NiLeDAM by Nathalie Vialaneix, Aurélie Mercadié, Jean-Marc Montel. Th-U-Pb electron microprobe age dating of monazite, as originally described in <doi:10.1016/0009-2541(96)00024-1>.
- nimble nimble by Perry de Valpine, Christopher Paciorek, Daniel Turek + 10 more. A system for writing hierarchical statistical models largely compatible with 'BUGS' and 'JAGS', writing nimbleFunctions to operate models and do basic R-style math, and compiling both models and nimbleFunctions via custom-generated C++. 'NIMBLE' includes default methods for MCMC, Laplace Approximation, deterministic nested approximations, Monte Carlo Expectation Maximization, and some other tools. The nimbleFunction system makes it easy to do things like implement new MCMC samplers from R, customize the assignment of samplers to different parts of a model from R, and compile the new samplers automatically via C++ alongside the samplers 'NIMBLE' provides. 'NIMBLE' extends the 'BUGS'/'JAGS' language by making it extensible: New distributions and functions can be added, including as calls to external compiled code. Although most people think of MCMC as the main goal of the 'BUGS'/'JAGS' language for writing models, one can use 'NIMBLE' for writing arbitrary other kinds of model-generic algorithms as well. A full User Manual is available at <https://r-nimble.org>.
 NMAoutlier by Maria Petropoulou, Guido Schwarzer, Agapios Panos + 1 more. A set of functions providing several outlier (i.e., studies with extreme findings) and influential detection measures and methodologies in network meta-analysis : - simple outlier and influential detection measures - outlier and influential detection measures by considering study deletion (shift the mean) - plots for outlier and influential detection measures - Q-Q plot for network meta-analysis - Forward Search algorithm in network meta-analysis. - forward plots to monitor statistics in each step of the forward search algorithm - forward plots for summary estimates and their confidence intervals in each step of forward search algorithm.
 odbr by Haydee Svab, Beatriz Milz, Diego Rabatone Oliveira + 1 more. Download data from Brazil's Origin Destination Surveys. The package covers both data from household travel surveys, dictionaries of variables, and the spatial geometries of surveys conducted in different years and across various urban areas in Brazil. For some cities, the package will include enhanced versions of the data sets with variables "harmonized" across different years.
 oddstream by Priyanga Dilini Talagala. We proposes a framework that provides real time support for early detection of anomalous series within a large collection of streaming time series data. By definition, anomalies are rare in comparison to a system's typical behaviour. We define an anomaly as an observation that is very unlikely given the forecast distribution. The algorithm first forecasts a boundary for the system's typical behaviour using a representative sample of the typical behaviour of the system. An approach based on extreme value theory is used for this boundary prediction process. Then a sliding window is used to test for anomalous series within the newly arrived collection of series. Feature based representation of time series is used as the input to the model. To cope with concept drift, the forecast boundary for the system's typical behaviour is updated periodically. More details regarding the algorithm can be found in Talagala, P. D., Hyndman, R. J., Smith-Miles, K., et al. (2019) <doi:10.1080/10618600.2019.1617160>.
 opencage by Daniel Possenriede, Jesse Sadler, Maëlle Salmon. Geocode with the OpenCage API, either from place name to longitude and latitude (forward geocoding) or from longitude and latitude to the name and address of a location (reverse geocoding), see <https://opencagedata.com/>.
 openintro by Mine Çetinkaya-Rundel, David Diez, Andrew Bray + 5 more. Supplemental functions and data for 'OpenIntro' resources, which includes open-source textbooks and resources for introductory statistics (<https://www.openintro.org/>). The package contains datasets used in our open-source textbooks along with custom plotting functions for reproducing book figures. Note that many functions and examples include color transparency; some plotting elements may not show up properly (or at all) when run in some versions of Windows operating system.
- ordinalClust ordinalClust by Margot Selosse, Julien Jacques, Christophe Biernacki. Ordinal data classification, clustering and co-clustering using model-based approach with the BOS (Binary Ordinal Search) distribution for ordinal data (Christophe Biernacki and Julien Jacques (2016) <doi:10.1007/s11222-015-9585-2>).
 oregonfrogs by Federica Gazzelloni. Oregon Frogs Rana Pretiosa dataset contains information about radio telemetry frequency used to study the frogs' habitat. The survey run from late September to November 2018. There are 311 observations and 16 variables.
 osmdata by Joan Maspons, Mark Padgham, Bob Rudis + 2 more. Download and import of 'OpenStreetMap' ('OSM') data as 'sf' or 'sp' objects. 'OSM' data are extracted from the 'Overpass' web server (<https://overpass-api.de/>) and processed with very fast 'C++' routines for return to 'R'.
 overviewR by Cosima Meyer, Dennis Hammerschmidt. Makes it easy to display descriptive information on a data set. Getting an easy overview of a data set by displaying and visualizing sample information in different tables (e.g., time and scope conditions). The package also provides publishable 'LaTeX' code to present the sample information.
- oxcAAR oxcAAR by Hinz Martin, Clemens Schmid, Daniel Knitter + 1 more. A set of tools that enables using 'OxCal' from within R. 'OxCal' (<https://c14.arch.ox.ac.uk/oxcal.html>) is a standard archaeological tool intended to provide 14C calibration and analysis of archaeological and environmental chronological information. 'OxcAAR' allows simple calibration with 'Oxcal' and plotting of the results as well as the execution of sophisticated ('OxCal') code and the import of the results of bulk analysis and complex Bayesian sequential calibration.
 palmerpenguins by Allison Horst, Alison Hill, Kristen Gorman. Size measurements, clutch observations, and blood isotope ratios for adult foraging Adélie, Chinstrap, and Gentoo penguins observed on islands in the Palmer Archipelago near Palmer Station, Antarctica. Data were collected and made available by Dr. Kristen Gorman and the Palmer Station Long Term Ecological Research (LTER) Program.
- pangaear pangaear by Scott Chamberlain, Kara Woo, Andrew MacDonald + 2 more. Tools to interact with the 'Pangaea' Database (<https://www.pangaea.de>), including functions for searching for data, fetching 'datasets' by 'dataset' 'ID', and working with the 'Pangaea' 'OAI-PMH' service.
- parmsurvfit parmsurvfit by Ashley Jacobson, Victor Wilson, Shannon Pileggi. Executes simple parametric models for right-censored survival data. Functionality emulates capabilities in 'Minitab', including fitting right-censored data, assessing fit, plotting survival functions, and summary statistics and probabilities.
- partykit partykit by Torsten Hothorn, Achim Zeileis. A toolkit with infrastructure for representing, summarizing, and visualizing tree-structured regression and classification models. This unified infrastructure can be used for reading/coercing tree models from different sources ('rpart', 'RWeka', 'PMML') yielding objects that share functionality for print()/plot()/predict() methods. Furthermore, new and improved reimplementations of conditional inference trees (ctree()) and model-based recursive partitioning (mob()) from the 'party' package are provided based on the new infrastructure. A description of this package was published by Hothorn and Zeileis (2015) <https://jmlr.org/papers/v16/hothorn15a.html>.
- PCADSC PCADSC by Anne Helby Petersen, Bo Markussen. A suite of non-parametric, visual tools for assessing differences in data structures for two datasets that contain different observations of the same variables. These tools are all based on Principal Component Analysis (PCA) and thus effectively address differences in the structures of the covariance matrices of the two datasets. The PCADSC tools consist of easy-to-use, intuitive plots that each focus on different aspects of the PCA decompositions. The cumulative eigenvalue (CE) plot describes differences in the variance components (eigenvalues) of the deconstructed covariance matrices. The angle plot presents the information loss when moving from the PCA decomposition of one dataset to the PCA decomposition of the other. The chroma plot describes the loading patterns of the two datasets, thereby presenting the relative weighting and importance of the variables from the original dataset.
 phoenics by Camille Guilmineau, Remi Servien, Nathalie Vialaneix. Perform a differential analysis at pathway level based on metabolite quantifications and information on pathway metabolite composition. The method, described in Guilmineau et al (2025) <doi:10.1186/s12859-025-06118-z> is based on a Principal Component Analysis step and on a linear mixed model. Automatic query of metabolic pathways is also implemented.
- phyloseq phyloseq by Paul J. McMurdie, Susan Holmes. phyloseq provides a set of classes and tools to facilitate the import, storage, analysis, and graphical display of microbiome census data.
 pins by Julia Silge, Hadley Wickham, Javier Luraschi + 1 more. Publish data sets, models, and other R objects, making it easy to share them across projects and with your colleagues. You can pin objects to a variety of "boards", including local folders (to share on a networked drive or with 'DropBox'), 'Posit Connect', 'AWS S3', and more.
 pkgdown by Hadley Wickham, Jay Hesselberth, Maëlle Salmon + 3 more. Generate an attractive and useful website from a source package. 'pkgdown' converts your documentation, vignettes, 'README', and more to 'HTML' making it easy to share information about your package online.
- pkgsearch pkgsearch by Gábor Csárdi, Maëlle Salmon. Search CRAN metadata about packages by keyword, popularity, recent activity, package name and more. Uses the 'R-hub' search server, see <https://r-pkg.org> and the CRAN metadata database, that contains information about CRAN packages. Note that this is _not_ a CRAN project.
 PKPDsim by Ron Keizer, Jasmine Hughes, Dominic Tong + 2 more. Simulate dose regimens for pharmacokinetic-pharmacodynamic (PK-PD) models described by differential equation (DE) systems. Simulation using ADVAN-style analytical equations is also supported (Abuhelwa et al. (2015) <doi:10.1016/j.vascn.2015.03.004>).
- PlackettLuce PlackettLuce by Heather Turner, Ioannis Kosmidis, David Firth. Functions to prepare rankings data and fit the Plackett-Luce model jointly attributed to Plackett (1975) <doi:10.2307/2346567> and Luce (1959, ISBN:0486441369). The standard Plackett-Luce model is generalized to accommodate ties of any order in the ranking. Partial rankings, in which only a subset of items are ranked in each ranking, are also accommodated in the implementation. Disconnected/weakly connected networks implied by the rankings may be handled by adding pseudo-rankings with a hypothetical item. Optionally, a multivariate normal prior may be set on the log-worth parameters and ranker reliabilities may be incorporated as proposed by Raman and Joachims (2014) <doi:10.1145/2623330.2623654>. Maximum a posteriori estimation is used when priors are set. Methods are provided to estimate standard errors or quasi-standard errors for inference as well as to fit Plackett-Luce trees. See the package website or vignette for further details.
 poissonreg by Max Kuhn, Hannah Frick, Posit Software. Bindings for Poisson regression models for use with the 'parsnip' package. Models include simple generalized linear models, Bayesian models, and zero-inflated Poisson models (Zeileis, Kleiber, and Jackman (2008) <doi:10.18637/jss.v027.i08>).
 PPforest by Natalia da Silva, Dianne Cook, Eun-Kyung Lee. Implements projection pursuit forest algorithm for supervised classification.
 pregnancy by Ella Kaye. Provides functionality for calculating pregnancy-related dates and tracking medications during pregnancy and fertility treatment. Calculates due dates from various starting points including last menstrual period and IVF (In Vitro Fertilisation) transfer dates, determines pregnancy progress on any given date, and identifies when specific pregnancy weeks are reached. Includes medication tracking capabilities for individuals undergoing fertility treatment or during pregnancy, allowing users to monitor remaining doses and quantities needed over specified time periods. Designed for those tracking their own pregnancies or supporting partners through the process, making use of options to personalise output messages. For details on due date calculations, see <https://www.acog.org/clinical/clinical-guidance/committee-opinion/articles/2017/05/methods-for-estimating-the-due-date>.
- prepdat prepdat by Ayala S. Allon, Roy Luria. Prepares data for statistical analysis (e.g., analysis of variance ;ANOVA) by enabling the user to easily and quickly merge (using the file_merge() function) raw data files into one merged table and then aggregate the merged table (using the prep() function) into a finalized table while keeping track and summarizing every step of the preparation. The finalized table contains several possibilities for dependent measures of the dependent variable. Most suitable when measuring variables in an interval or ratio scale (e.g., reaction-times) and/or discrete values such as accuracy. Main functions included are file_merge() and prep(). The file_merge() function vertically merges individual data files (in a long format) in which each line is a single observation to one single dataset. The prep() function aggregates the single dataset according to any combination of grouping variables (i.e., between-subjects and within-subjects independent variables, respectively), and returns a data frame with a number of dependent measures for further analysis for each cell according to the combination of provided grouping variables. Dependent measures for each cell include among others means before and after rejecting all values according to a flexible standard deviation criteria, number of rejected values according to the flexible standard deviation criteria, proportions of rejected values according to the flexible standard deviation criteria, number of values before rejection, means after rejecting values according to procedures described in Van Selst & Jolicoeur (1994; suitable when measuring reaction-times), standard deviations, medians, means according to any percentile (e.g., 0.05, 0.25, 0.75, 0.95) and harmonic means. The data frame prep() returns can also be exported as a txt file to be used for statistical analysis in other statistical programs.
- PreProcessRecordLinkage PreProcessRecordLinkage by Hossein Hassani, Leila Marvian Mashhad. In this record linkage package, data preprocessing has been meticulously executed to cover a wide range of datasets, ensuring that variable names are standardized using synonyms. This approach facilitates seamless data integration and analysis across various datasets. While users have the flexibility to modify variable names, the system intelligently ensures that changes are only permitted when they do not compromise data consistency or essential variable essence.
 PrettyCols by Nicola Rennie. Defines aesthetically pleasing colour palettes.
 projmgr by Emily Riederer. Provides programmatic access to 'GitHub' API with a focus on project management. Key functionality includes setting up issues and milestones from R objects or 'YAML' configurations, querying outstanding or completed tasks, and generating progress updates in tables, charts, and RMarkdown reports. Useful for those using 'GitHub' in personal, professional, or academic settings with an emphasis on streamlining the workflow of data analysis projects.
- ProliferativeIndex ProliferativeIndex by Brittany Lasseigne, Ryne Ramaker. Provides functions for calculating and analyzing the proliferative index (PI) from an RNA-seq dataset. As described in Ramaker & Lasseigne, et al. bioRxiv, 2016 <doi:10.1101/063057>.
- psidread psidread by Shuyi Qiu. Streamline the management, creation, and formatting of panel data from the Panel Study of Income Dynamics ('PSID') <https://psidonline.isr.umich.edu> using this user-friendly tool. Simply define variable names and input code book details directly from the 'PSID' official website, and this toolbox will efficiently facilitate the data preparation process, transforming raw 'PSID' files into a well-organized format ready for further analysis.
- psychomix psychomix by Hannah Frick, Friedrich Leisch, Carolin Strobl + 2 more. Psychometric mixture models based on 'flexmix' infrastructure. At the moment Rasch mixture models with different parameterizations of the score distribution (saturated vs. mean/variance specification), Bradley-Terry mixture models, and MPT mixture models are implemented. These mixture models can be estimated with or without concomitant variables. See Frick et al. (2012) <doi:10.18637/jss.v048.i07> and Frick et al. (2015) <doi:10.1177/0013164414536183> for details on the Rasch mixture models.
- qsmooth qsmooth by Stephanie C. Hicks, Kwame Okrah, Hector Corrada Bravo + 1 more. Smooth quantile normalization is a generalization of quantile normalization, which is average of the two types of assumptions about the data generation process: quantile normalization and quantile normalization between groups.
 qtwAcademic by Chi Zhang. Provides three 'Quarto' website templates as an R project, which are commonly used by academics. Templates for personal websites and course/workshop websites are included, as well as a template with minimal content for customization.
 quadkeyr by Florencia D'Andrea, Pilar Fernandez, Paul G. Allen School for Global Health. A set of functions of increasing complexity allows users to (1) convert QuadKey-identified datasets, based on 'Microsoft's Bing Maps Tile System', into Simple Features data frames, (2) transform Simple Features data frames into rasters, and (3) process multiple 'Meta' ('Facebook') QuadKey-identified human mobility files directly into raster files. For more details, see D’Andrea et al. (2024) <doi:10.21105/joss.06500>.
 qualtRics by Jasper Ginn, Joseph O'Brien, Julia Silge. Provides functions to access survey results directly into R using the 'Qualtrics' API. 'Qualtrics' <https://www.qualtrics.com/about/> is an online survey and data collection software platform. See <https://api.qualtrics.com/> for more information about the 'Qualtrics' API. This package is community-maintained and is not officially supported by 'Qualtrics'.
- quantro quantro by Stephanie Hicks, Rafael Irizarry. A data-driven test for the assumptions of quantile normalization using raw data such as objects that inherit eSets (e.g. ExpressionSet, MethylSet). Group level information about each sample (such as Tumor / Normal status) must also be provided because the test assesses if there are global differences in the distributions between the user-defined groups.
- quartose quartose by Danielle Navarro. Provides helper functions to work programmatically within a quarto document. It allows the user to create section headers, tabsets, divs, and spans, and formats these objects into quarto syntax when printed into a document.
- QueryWikidataR QueryWikidataR by Serena Signorelli. QueryWikidataR allows to query for Wikidata items with geocoordinates in three different ways, to get the list of related Wikipedia articles with languages and to get the properties (P31) and the classes (P279) they belong to. The package also allows to query for an item from a known property and a value of this property that you can decide to set. The functionalities of the package will be enhanced.
- queue queue by Danielle Navarro. Implements a simple multi-threaded task queue using R6 classes.
 rainbowr by Danielle Navarro. Generates a variety of LGBT flags (e.g., rainbow, transgender) overlaid with the R logo, using the magick package. Also generates hex stickers based on LGBT flags and tilings thereof.
- RCMIP5 RCMIP5 by Ben Bond-Lamberty, Kathe Todd-Brown. Working with CMIP5 data can be tricky, forcing scientists to write custom scripts and programs. The `RCMIP5` package aims to ease this process, providing a standard, robust, and high-performance set of scripts to (i) explore what data have been downloaded, (ii) identify missing data, (iii) average (or apply other mathematical operations) across experimental ensembles, (iv) produce both temporal and spatial statistical summaries, and (v) produce easy-to-work-with graphical and data summaries.
- rddapp rddapp by Ze Jin, Wang Liao, Irena Papst + 3 more. Estimation of both single- and multiple-assignment Regression Discontinuity Designs (RDDs). Provides both parametric (global) and non-parametric (local) estimation choices for both sharp and fuzzy designs, along with power analysis and assumption checks. Introductions to the underlying logic and analysis of RDDs are in Thistlethwaite, D. L., Campbell, D. T. (1960) <doi:10.1037/h0044319> and Lee, D. S., Lemieux, T. (2010) <doi:10.1257/jel.48.2.281>.
 readr by Hadley Wickham, Jim Hester, Jennifer Bryan + 1 more. The goal of 'readr' is to provide a fast and friendly way to read rectangular data (like 'csv', 'tsv', and 'fwf'). It is designed to flexibly parse many types of data found in the wild, while still cleanly failing when data unexpectedly changes.
 readxl by Hadley Wickham, Jennifer Bryan, Posit. Import excel files into R. Supports '.xls' via the embedded 'libxls' C library <https://github.com/libxls/libxls> and '.xlsx' via the embedded 'RapidXML' C++ library <https://rapidxml.sourceforge.net/>. Works on Windows, Mac and Linux without external dependencies.
- redcapAPI redcapAPI by Benjamin Nutter, Shawn Garbett, Jeffrey Horner. Access data stored in 'REDCap' databases using the Application Programming Interface (API). 'REDCap' (Research Electronic Data CAPture; <https://projectredcap.org>, Harris, et al. (2009) <doi:10.1016/j.jbi.2008.08.010>, Harris, et al. (2019) <doi:10.1016/j.jbi.2019.103208>) is a web application for building and managing online surveys and databases developed at Vanderbilt University. The API allows users to access data and project meta data (such as the data dictionary) from the web programmatically. The 'redcapAPI' package facilitates the process of accessing data with options to prepare an analysis-ready data set consistent with the definitions in a database's data dictionary.
- regscoreR regscoreR by Simran Sethi, Ha Dinh, Ruoqi Xu. An R package to compute scores for different regression models.
 reprex by Jennifer Bryan, Jim Hester, David Robinson + 3 more. Convenience wrapper that uses the 'rmarkdown' package to render small snippets of code to target formats that include both code and output. The goal is to encourage the sharing of small, reproducible, and runnable examples on code-oriented websites, such as <https://stackoverflow.com> and <https://github.com>, or in email. The user's clipboard is the default source of input code and the default target for rendered output. 'reprex' also extracts clean, runnable R code from various common formats, such as copy/paste from an R session.
- repurrrsive repurrrsive by Jennifer Bryan, Posit Software. Recursive lists in the form of R objects, 'JSON', and 'XML', for use in teaching and examples. Examples include color palettes, Game of Thrones characters, 'GitHub' users and repositories, music collections, and entities from the Star Wars universe. Data from the 'gapminder' package is also included, as a simple data frame and in nested and split forms.
- rHealthDataGov rHealthDataGov by Erin LeDell. An R interface for the HealthData.gov data API. For each data resource, you can filter results (server-side) to select subsets of data.
 rhub by Gábor Csárdi, Maëlle Salmon. R-hub v2 uses GitHub Actions to run 'R CMD check' and similar package checks. The 'rhub' package helps you set up R-hub v2 for your R package, and start running checks.
 riem by Maëlle Salmon, Jonathan Elchison. Allows to get weather data from Automated Surface Observing System (ASOS) stations (airports) in the whole world thanks to the Iowa Environment Mesonet website.
- riverbed riverbed by Lise Vaudor. This package is intended to facilitate the calculation of surfaces and volumes described with profiles (such as river long profiles or river transects).
- rjtools rjtools by Mitchell O'Hara-Wild, Stephanie Kobakian, H. Sherry Zhang + 4 more. Create an 'R Journal' 'Rmarkdown' template article, that will generate html and pdf versions of your paper. Check that the paper folder has all the required components needed for submission. Examples of 'R Journal' publications can be found at <https://journal.r-project.org>.
- RNAseqNet RNAseqNet by Alyssa Imbert, Nathalie Vialaneix. Infer log-linear Poisson Graphical Model with an auxiliary data set. Hot-deck multiple imputation method is used to improve the reliability of the inference with an auxiliary dataset. Standard log-linear Poisson graphical model can also be used for the inference and the Stability Approach for Regularization Selection (StARS) is implemented to drive the selection of the regularization parameter. The method is fully described in <doi:10.1093/bioinformatics/btx819>.
 roblog by Maëlle Salmon, Stefanie Butland. It provides templates for roweb2 blogging and help for a GitHub forking workflow.
 rsample by Hannah Frick, Fanny Chow, Max Kuhn + 4 more. Classes and functions to create and summarize different types of resampling objects (e.g. bootstrap, cross-validation).
- rsparkling rsparkling by Jakub Hava, Navdeep Gill, Erin LeDell + 2 more. An extension package for 'sparklyr' that provides an R interface to H2O Sparkling Water machine learning library (see <https://github.com/h2oai/sparkling-water> for more information).
 RSSthemes by Nicola Rennie. Defines colour palettes and themes for Royal Statistical Society (RSS) publications, including Significance magazine. Palettes and themes are supported in both base R and 'ggplot2' graphics, and are intended to be used by authors submitting to RSS publications.
- rstanemax rstanemax by Kenta Yoshida, Danielle Navarro. Perform sigmoidal Emax model fit using 'Stan' in a formula notation, without writing 'Stan' model code.
- RUVcorr RUVcorr by Saskia Freytag. RUVcorr allows to apply global removal of unwanted variation (ridged version of RUV) to real and simulated gene expression data.
- saguaRo saguaRo by Stacey Borrego. Combining Arizona's desert beauty and the exciting world of data visualization. This package highlights the beautiful images taken in the Sonoran desert as captured by Tucson residents and friends of the Arizona-Sonora Desert Museum.
- scDD scDD by Keegan Korthauer. This package implements a method to analyze single-cell RNA- seq Data utilizing flexible Dirichlet Process mixture models. Genes with differential distributions of expression are classified into several interesting patterns of differences between two conditions. The package also includes functions for simulating data with these patterns from negative binomial distributions.
- scShapes scShapes by Malindrie Dharmaratne. We present a novel statistical framework for identifying differential distributions in single-cell RNA-sequencing (scRNA-seq) data between treatment conditions by modeling gene expression read counts using generalized linear models (GLMs). We model each gene independently under each treatment condition using error distributions Poisson (P), Negative Binomial (NB), Zero-inflated Poisson (ZIP) and Zero-inflated Negative Binomial (ZINB) with log link function and model based normalization for differences in sequencing depth. Since all four distributions considered in our framework belong to the same family of distributions, we first perform a Kolmogorov-Smirnov (KS) test to select genes belonging to the family of ZINB distributions. Genes passing the KS test will be then modeled using GLMs. Model selection is done by calculating the Bayesian Information Criterion (BIC) and likelihood ratio test (LRT) statistic.
 seer by Thiyanga Talagala, Rob J Hyndman, George Athanasopoulos. A novel meta-learning framework for forecast model selection using time series features. Many applications require a large number of time series to be forecast. Providing better forecasts for these time series is important in decision and policy making. We propose a classification framework which selects forecast models based on features calculated from the time series. We call this framework FFORMS (Feature-based FORecast Model Selection). FFORMS builds a mapping that relates the features of time series to the best forecast model using a random forest. 'seer' package is the implementation of the FFORMS algorithm. For more details see our paper at <https://www.monash.edu/business/econometrics-and-business-statistics/research/publications/ebs/wp06-2018.pdf>.
- sendplot sendplot by Daniel P Gaile, Lori A. Shepherd, Lara Sucheston + 2 more. A tool for visualizing data
 sensiPhy by Gustavo Paterno, Gijsbert Werner, Caterina Penone. An implementation of sensitivity analysis for phylogenetic comparative methods. The package is an umbrella of statistical and graphical methods that estimate and report different types of uncertainty in PCM: (i) Species Sampling uncertainty (sample size; influential species and clades). (ii) Phylogenetic uncertainty (different topologies and/or branch lengths). (iii) Data uncertainty (intraspecific variation and measurement error).
 SeroTrackR by Dionne Argyropoulos. Data wrangling and cleaning, quality control checks and implementation of machine learning classification algorithm.
- sessioncheck sessioncheck by Danielle Navarro. Provides tools to check variables contained in the user environment, and inspect the currently loaded package namespaces. The intended use is to allow user scripts to throw errors or warnings if unwanted variables exist or if unwanted packages are loaded.
 sfnetworks by Lucas van der Meer, Lorena Abad, Andrea Gilardi + 1 more. Provides a tidy approach to spatial network analysis, in the form of classes and functions that enable a seamless interaction between the network analysis package 'tidygraph' and the spatial analysis package 'sf'.
- ShapeRotator ShapeRotator by Marta Vidal-Garcia, Lashi Bandara, J. Scott Keogh. Here we describe a simple geometric rigid rotation approach that removes the effect of random translation and rotation, enabling the morphological analysis of 3D articulated structures. Our method is based on Cartesian coordinates in 3D space so it can be applied to any morphometric problem that also uses 3D coordinates.
- shinycustomloader shinycustomloader by Emi Tanaka and Niichan. A custom css/html or gif/image file for the loading screen in R 'shiny'. It also can use the marquee to have custom text loading screen.
- shinyfa shinyfa by Jasmine Daly. Provides tools for analyzing and understanding the file contents of large 'shiny' application directories. The package extracts key information about render functions, reactive functions, and their inputs from app files, organizing them into structured data frames for easy reference. This streamlines the onboarding process for new contributors and helps identify areas for optimization in complex 'shiny' codebases with multiple files and sourcing chains.
 shinyLP by Jasmine Daly. Provides functions that wrap HTML Bootstrap components code to enable the design and layout of informative landing home pages for Shiny applications. This can lead to a better user experience for the users and writing less HTML for the developer.
 shinymatic by Karina Bartolome. Extension of shiny. Allows the automatic generation of inputs based on a dataframe.
 shinyMobile by David Granjon, Veerle van Leemput, Victor Perrier + 1 more. Develop outstanding 'shiny' apps for 'iOS' and 'Android' as well as beautiful 'shiny' gadgets. 'shinyMobile' is built on top of the latest 'Framework7' template <https://framework7.io>. Discover 14 new input widgets (sliders, vertical sliders, stepper, grouped action buttons, toggles, picker, smart select, ...), 2 themes (light and dark), 12 new widgets (expandable cards, badges, chips, timelines, gauges, progress bars, ...) combined with the power of server-side notifications such as alerts, modals, toasts, action sheets, sheets (and more) as well as 3 layouts (single, tabs and split).
- shinymodels shinymodels by Max Kuhn, Shisham Adhikari, Julia Silge + 2 more. Launch a 'shiny' application for 'tidymodels' results. For classification or regression models, the app can be used to determine if there is lack of fit or poorly predicted points.
- siga siga by Yanina Bellini Saibene, Elio Campitelli, Paola Corrales + 1 more. Descarga y lee datos del Sistema de Información y Gestión Agrometeorológica del INTA <http://siga.inta.gob.ar/>.
- simex simex by Wolfgang Lederer, Heidi Seibold. Implementation of the SIMEX-Algorithm by Cook & Stefanski (1994) <doi:10.1080/01621459.1994.10476871> and MCSIMEX by Küchenhoff, Mwalili & Lesaffre (2006) <doi:10.1111/j.1541-0420.2005.00396.x>.
- SISINTAR SISINTAR by Yanina Bellini Saibene, Elio Campitelli, Paola Corrales. Permite descargar y manipular datos de perfiles de suelo disponibles en la plataforma SISINTA.
 SISIR by Victor Picheny, Remi Servien, Nathalie Vialaneix. Interval fusion and selection procedures for regression with functional inputs. Methods include a semiparametric approach based on Sliced Inverse Regression (SIR), as described in <doi:10.1007/s11222-018-9806-6> (standard ridge and sparse SIR are also included in the package) and a random forest based approach, as described in <doi:10.1002/sam.11705>.
 skimr by Elin Waring, Michael Quinn, Amelia McNamara + 4 more. A simple to use summary function that can be used with pipes and displays nicely in the console. The default summary statistics may be modified by the user as can the default formatting. Support for data frames and vectors is included, and users can implement their own skim methods for specific object types as described in a vignette. Default summaries include support for inline spark graphs. Instructions for managing these on specific operating systems are given in the "Using skimr" vignette and the README.
 sknifedatar by Rafael Zambrano, Karina Bartolome. Extension of the 'modeltime' ecosystem. In addition. Allows fitting of multiple models over multiple time series. It also provides a bridge for using the 'workflowsets' package with 'modeltime'. It includes some functionalities for spatial data and visualization.
- slingshot slingshot by Kelly Street, Davide Risso, Diya Das. Provides functions for inferring continuous, branching lineage structures in low-dimensional data. Slingshot was designed to model developmental trajectories in single-cell RNA sequencing data and serve as a component in an analysis pipeline after dimensionality reduction and clustering. It is flexible enough to handle arbitrarily many branching events and allows for the incorporation of prior knowledge through supervised graph construction.
- smbdata smbdata by Emi Tanaka. All data in the book "Statistical Methods in Biology" by Welham et al. (2015) <doi:10.1201/b17336> with a corresponding documentation and illustrative analysis of the data.
 SOMbrero by Nathalie Vialaneix, Elise Maigne, Jerome Mariette + 2 more. The stochastic (also called on-line) version of the Self-Organising Map (SOM) algorithm is provided. Different versions of the algorithm are implemented, for numeric and relational data and for contingency tables as described, respectively, in Kohonen (2001) <isbn:3-540-67921-9>, Olteanu & Villa-Vialaneix (2005) <doi:10.1016/j.neucom.2013.11.047> and Cottrell et al (2004) <doi:10.1016/j.neunet.2004.07.010>. The package also contains many plotting features (to help the user interpret the results), can handle (and impute) missing values and is delivered with a graphical user interface based on 'shiny'.
- SparseSignatures SparseSignatures by Daniele Ramazzotti, Avantika Lal, Luca De Sano + 1 more. Point mutations occurring in a genome can be divided into 96 categories based on the base being mutated, the base it is mutated into and its two flanking bases. Therefore, for any patient, it is possible to represent all the point mutations occurring in that patient's tumor as a vector of length 96, where each element represents the count of mutations for a given category in the patient. A mutational signature represents the pattern of mutations produced by a mutagen or mutagenic process inside the cell. Each signature can also be represented by a vector of length 96, where each element represents the probability that this particular mutagenic process generates a mutation of the 96 above mentioned categories. In this R package, we provide a set of functions to extract and visualize the mutational signatures that best explain the mutation counts of a large number of patients.
 spatialsample by Michael Mahoney, Julia Silge, Posit Software. Functions and classes for spatial resampling to use with the 'rsample' package, such as spatial cross-validation (Brenning, 2012) <doi:10.1109/IGARSS.2012.6352393>. The scope of 'rsample' and 'spatialsample' is to provide the basic building blocks for creating and analyzing resamples of a spatial data set, but neither package includes functions for modeling or computing statistics. The resampled spatial data sets created by 'spatialsample' do not contain much overhead in memory.
- SPBB SPBB by Pratheepa Jeganathan. Construct a confidence interval for a parameter using the saddlepoint approximation
- statsr statsr by Colin Rundel, Mine Cetinkaya-Rundel, Merlise Clyde + 1 more. Data and functions to support Bayesian and frequentist inference and decision making for the Coursera Specialization "Statistics with R". See <https://github.com/StatsWithR/statsr> for more information.
 stray by Priyanga Dilini Talagala. This is a modification of 'HDoutliers' package. The 'HDoutliers' algorithm is a powerful unsupervised algorithm for detecting anomalies in high-dimensional data, with a strong theoretical foundation. However, it suffers from some limitations that significantly hinder its performance level, under certain circumstances. This package implements the algorithm proposed in Talagala, Hyndman and Smith-Miles (2019) <arXiv:1908.04000> for detecting anomalies in high-dimensional data that addresses these limitations of 'HDoutliers' algorithm. We define an anomaly as an observation that deviates markedly from the majority with a large distance gap. An approach based on extreme value theory is used for the anomalous threshold calculation.
- subsemble subsemble by Erin LeDell, Stephanie Sapp, Mark van der Laan. The Subsemble algorithm is a general subset ensemble prediction method, which can be used for small, moderate, or large datasets. Subsemble partitions the full dataset into subsets of observations, fits a specified underlying algorithm on each subset, and uses a unique form of k-fold cross-validation to output a prediction function that combines the subset-specific fits. An oracle result provides a theoretical performance guarantee for Subsemble. The paper, "Subsemble: An ensemble method for combining subset-specific algorithm fits" is authored by Stephanie Sapp, Mark J. van der Laan & John Canny (2014) <doi:10.1080/02664763.2013.864263>.
- superheat superheat by Rebecca Barter, Bin Yu. A system for generating extendable and customizable heatmaps for exploring complex datasets, including big data and data with multiple data types.
- SuperLearner SuperLearner by Eric Polley, Erin LeDell, Chris Kennedy + 1 more. Implements the super learner prediction method and contains a library of prediction algorithms to be used in the super learner.
- tableHTML tableHTML by Theo Boutaris, Clemens Zauchner, Dana Jomar. A tool to create and style HTML tables with CSS. These can be exported and used in any application that accepts HTML (e.g. 'shiny', 'rmarkdown', 'PowerPoint'). It also provides functions to create CSS files (which also work with shiny).
- tailloss tailloss by Isabella Gollini. Set of tools to estimate the probability in the upper tail of the aggregate loss distribution using different methods: Panjer recursion, Monte Carlo simulations, Markov bound, Cantelli bound, Moment bound, and Chernoff bound.
- tailor tailor by Simon Couch, Hannah Frick, Emil HvitFeldt + 2 more. Postprocessors refine predictions outputted from machine learning models to improve predictive performance or better satisfy distributional limitations. This package introduces 'tailor' objects, which compose iterative adjustments to model predictions. A number of pre-written adjustments are provided with the package, such as calibration. See Lichtenstein, Fischhoff, and Phillips (1977) <doi:10.1007/978-94-010-1276-8_19>. Other methods and utilities to compose new adjustments are also included. Tailors are tightly integrated with the 'tidymodels' framework.
 tanggle by Klaus Schliep, Marta Vidal-Garcia, Claudia Solis-Lemus + 4 more. Offers functions for plotting split (or implicit) networks (unrooted, undirected) and explicit networks (rooted, directed) with reticulations extending. 'ggtree' and using functions from 'ape' and 'phangorn'. It extends the 'ggtree' package [@Yu2017] to allow the visualization of phylogenetic networks using the 'ggplot2' syntax. It offers an alternative to the plot functions already available in 'ape' Paradis and Schliep (2019) <doi:10.1093/bioinformatics/bty633> and 'phangorn' Schliep (2011) <doi:10.1093/bioinformatics/btq706>.
- TEQC TEQC by M. Hummel, S. Bonnin, E. Lowy + 2 more. Target capture experiments combine hybridization-based (in solution or on microarrays) capture and enrichment of genomic regions of interest (e.g. the exome) with high throughput sequencing of the captured DNA fragments. This package provides functionalities for assessing and visualizing the quality of the target enrichment process, like specificity and sensitivity of the capture, per-target read coverage and so on.
- TextMiningTutorial TextMiningTutorial by Yanina Bellini Saibene. Tutorial de introducción a Text Mining
- tidylo tidylo by Tyler Schnoebelen, Julia Silge, Alex Hayes. How can we measure how the usage or frequency of some feature, such as words, differs across some group or set, such as documents? One option is to use the log odds ratio, but the log odds ratio alone does not account for sampling variability; we haven't counted every feature the same number of times so how do we know which differences are meaningful? Enter the weighted log odds, which 'tidylo' provides an implementation for, using tidy data principles. In particular, here we use the method outlined in Monroe, Colaresi, and Quinn (2008) <doi:10.1093/pan/mpn018> to weight the log odds ratio by a prior. By default, the prior is estimated from the data itself, an empirical Bayes approach, but an uninformative prior is also available.
- tidyquintro tidyquintro by Athanasia Mo Mowinckel. A 4 hour workshop with quick introduction to tidyverse.
 tidytext by David Robinson, Julia Silge. Using tidy data principles can make many text mining tasks easier, more effective, and consistent with tools already in wide use. Much of the infrastructure needed for text mining with tidy data frames already exists in packages like 'dplyr', 'broom', 'tidyr', and 'ggplot2'. In this package, we provide functions and supporting data sets to allow conversion of text to and from tidy formats, and to switch seamlessly between tidy tools and existing text mining packages.
 TidyTuesdayAltText by Silvia Canelón, Thomas Mock. Alternative (alt) text for media attached to tweets participating in the TidyTuesday data visualization learning community.
 tinkr by Maëlle Salmon, Zhian N. Kamvar, Jeroen Ooms. Parsing '(R)Markdown' files with numerous regular expressions can be fraught with peril, but it does not have to be this way. Converting '(R)Markdown' files to 'XML' using the 'commonmark' package allows in-memory editing via of 'markdown' elements via 'XPath' through the extensible 'R6' class called 'yarn'. These modified 'XML' representations can be written to '(R)Markdown' documents via an 'xslt' stylesheet which implements an extended version of 'GitHub'-flavoured 'markdown' so that you can tinker to your hearts content.
 tourr by Hadley Wickham, Dianne Cook. Implements geodesic interpolation and basis generation functions that allow you to create new tour methods from R.
 trackeR by Ioannis Kosmidis, Hannah Frick, Robin Hornak. Provides infrastructure for handling running, cycling and swimming data from GPS-enabled tracking devices within R. The package provides methods to extract, clean and organise workout and competition data into session-based and unit-aware data objects of class 'trackeRdata' (S3 class). The information can then be visualised, summarised, and analysed through flexible and extensible methods. Frick and Kosmidis (2017) <doi: 10.18637/jss.v082.i07>, which is updated and maintained as one of the vignettes, provides detailed descriptions of the package and its methods, and real-data demonstrations of the package functionality.
- traudem traudem by Luca Carraro, Maëlle Salmon, Wael Sadek + 1 more. Simple trustworthy utility functions to use TauDEM (Terrain Analysis Using Digital Elevation Models <https://hydrology.usu.edu/taudem/taudem5/>) command-line interface. This package provides a guide to installation of TauDEM and its dependencies GDAL (Geopatial Data Abstraction Library) and MPI (Message Passing Interface) for different operating systems. Moreover, it checks that TauDEM and its dependencies are correctly installed and included to the PATH, and it provides wrapper commands for calling TauDEM methods from R.
- treediff treediff by Nathalie Vialaneix, Gwendaelle Cardenas, Marie Chavent + 3 more. Perform test to detect differences in structure between families of trees. The method is based on cophenetic distances and aggregated Student's tests.
 tsfeatures by Rob Hyndman, Yanfei Kang, Pablo Montero-Manso + 4 more. Methods for extracting various features from time series data. The features provided are those from Hyndman, Wang and Laptev (2013) <doi:10.1109/ICDMW.2015.104>, Kang, Hyndman and Smith-Miles (2017) <doi:10.1016/j.ijforecast.2016.09.004> and from Fulcher, Little and Jones (2013) <doi:10.1098/rsif.2013.0048>. Features include spectral entropy, autocorrelations, measures of the strength of seasonality and trend, and so on. Users can also define their own feature functions.
 ttbbeer by Jasmine Daly. U.S. Department of the Treasury, Alcohol and Tobacco Tax and Trade Bureau (TTB) collects data and reports on monthly beer industry production and operations. This data package includes a collection of 10 years (2006 - 2015) worth of data on materials used at U.S. breweries in pounds reported by the Brewer's Report of Operations and the Quarterly Brewer's Report of Operations forms, ready for data analysis. This package also includes historical tax rates on distilled spirits, wine, beer, champagne, and tobacco products as individual data sets.
- TutorialgRaficosFN TutorialgRaficosFN by Yanina Bellini Saibene, Yanina Bellini Saibene. Tutorial para generar gráficos en R festejando a Florence Nightingale
- TutorialIterar TutorialIterar by Yanina Bellini Saibene. este paquete contiene dos turoriales de learnr para aprender for loops y map.
 typeR by Federica Gazzelloni. Simulates typing of R script files for presentations and demonstrations. Provides character-by-character animation with optional live code execution. Supports R scripts (.R), R Markdown (.Rmd), and Quarto (.qmd) documents.
- uiothemes uiothemes by Athanasia Mo Mowinckel. Contains templates, themeing files and functions. Made specifically for branding purposes for the University of Oslo.
- ukbabynames ukbabynames by Mine Çetinkaya-Rundel, Thomas J. Leeper, Nicholas Goguen-Compagnoni + 1 more. Full listing of UK baby names occurring more than three times per year between 1974 and 2020, and rankings of baby name popularity by decade from 1904 to 1994.
- UniversalCVI UniversalCVI by Nathakhun Wiroonsri, Onthada Preedasawakul. Algorithms for checking the accuracy of a clustering result with known classes, computing cluster validity indices, and generating plots for comparing them. The package is compatible with K-means, fuzzy C means, EM clustering, and hierarchical clustering (single, average, and complete linkage). The details of the indices in this package can be found in: J. C. Bezdek, M. Moshtaghi, T. Runkler, C. Leckie (2016) <doi:10.1109/TFUZZ.2016.2540063>, T. Calinski, J. Harabasz (1974) <doi:10.1080/03610927408827101>, C. H. Chou, M. C. Su, E. Lai (2004) <doi:10.1007/s10044-004-0218-1>, D. L. Davies, D. W. Bouldin (1979) <doi:10.1109/TPAMI.1979.4766909>, J. C. Dunn (1973) <doi:10.1080/01969727308546046>, F. Haouas, Z. Ben Dhiaf, A. Hammouda, B. Solaiman (2017) <doi:10.1109/FUZZ-IEEE.2017.8015651>, M. Kim, R. S. Ramakrishna (2005) <doi:10.1016/j.patrec.2005.04.007>, S. H. Kwon (1998) <doi:10.1049/EL:19981523>, S. H. Kwon, J. Kim, S. H. Son (2021) <doi:10.1049/ell2.12249>, G. W. Miligan (1980) <doi:10.1007/BF02293907>, M. K. Pakhira, S. Bandyopadhyay, U. Maulik (2004) <doi:10.1016/j.patcog.2003.06.005>, M. Popescu, J. C. Bezdek, T. C. Havens, J. M. Keller (2013) <doi:10.1109/TSMCB.2012.2205679>, S. Saitta, B. Raphael, I. Smith (2007) <doi:10.1007/978-3-540-73499-4_14>, A. Starczewski (2017) <doi:10.1007/s10044-015-0525-8>, Y. Tang, F. Sun, Z. Sun (2005) <doi:10.1109/ACC.2005.1470111>, N. Wiroonsri (2024) <doi:10.1016/j.patcog.2023.109910>, N. Wiroonsri, O. Preedasawakul (2023) <doi:10.48550/arXiv.2308.14785>, C. H. Wu, C. S. Ouyang, L. W. Chen, L. W. Lu (2015) <doi:10.1109/TFUZZ.2014.2322495>, X. Xie, G. Beni (1991) <doi:10.1109/34.85677> and P.J. Rousseeuw (1987) and L. Kaufman and P.J. Rousseeuw(2009) <doi:10.1016/0377-0427(87)90125-7> and <doi:10.1002/9780470316801> C. Alok. (2010).
 USAboundaries by Lincoln Mullen, Jordan Bratt, Jacci Ziebert. The boundaries for geographical units in the United States of America contained in this package include state, county, congressional district, and zip code tabulation area. Contemporary boundaries are provided by the U.S. Census Bureau (public domain). Historical boundaries for the years from 1629 to 2000 are provided form the Newberry Library's Atlas of Historical County Boundaries (licensed CC BY-NC-SA). Additional data is provided in the USAboundariesData package; this package provides an interface to access that data.
- USCensus2020 USCensus2020 by shreshtha modi. This packages provides the access to the 2020 redistricting data and the helper functions which are used to better access and format the data
 usdata by Mine Çetinkaya-Rundel, David Diez, Leah Dorazio. Demographic data on the United States at the county and state levels spanning multiple years.
 usethis by Hadley Wickham, Jennifer Bryan, Malcolm Barrett + 2 more. Automate package and project setup tasks that are otherwise performed manually. This includes setting up unit testing, test coverage, continuous integration, Git, 'GitHub', licenses, 'Rcpp', 'RStudio' projects, and more.
 vagalumeR by Bruna Wundervald. Provides access to the 'Vagalume' API <https://api.vagalume.com.br>. The data extracted is basically lyrics of songs and information about artists/bands.
 vcdExtra by Michael Friendly. Provides additional data sets, methods and documentation to complement the 'vcd' package for Visualizing Categorical Data and the 'gnm' package for Generalized Nonlinear Models. In particular, 'vcdExtra' extends mosaic, assoc and sieve plots from 'vcd' to handle 'glm()' and 'gnm()' models and adds a 3D version in 'mosaic3d'. Additionally, methods are provided for comparing and visualizing lists of 'glm' and 'loglm' objects. This package is now a support package for the book, "Discrete Data Analysis with R" by Michael Friendly and David Meyer.
 vcr by Scott Chamberlain, Aaron Wolen, Maëlle Salmon + 2 more. Record test suite 'HTTP' requests and replays them during future runs. A port of the Ruby gem of the same name (<https://github.com/vcr/vcr/>). Works by recording real 'HTTP' requests/responses on disk in 'cassettes', and then replaying matching responses on subsequent requests.
- verbaliseR verbaliseR by Cara Thompson. Turn R analysis outputs into full sentences, by writing vectors into in-sentence lists, pluralising words conditionally, spelling out numbers if they are at the start of sentences, writing out dates in full following US or UK style, and managing capitalisations in tidy data.
- verdadecu verdadecu by Adriana Robles, Javier Borja. Provides access to data collected by the Ecuadorian Truth Commission. Allows users to extract and analyze systematized information for human rights research in Ecuador. The package contains datasets documenting human rights violations from 1984-2008, including victim information, violation types, perpetrators, and geographic distribution.
 vetiver by Julia Silge, Posit Software. The goal of 'vetiver' is to provide fluent tooling to version, share, deploy, and monitor a trained model. Functions handle both recording and checking the model's input data prototype, and predicting from a remote API endpoint. The 'vetiver' package is extensible, with generics that can support many kinds of models.
 vivo by Anna Kozak, Przemyslaw Biecek. Provides an easy to calculate local variable importance measure based on Ceteris Paribus profile and global variable importance measure based on Partial Dependence Profiles.
 Vizumap by Lydia Lucchesi, Petra Kuhnert. Vizumap provides four uncertainty visualization approaches for spatial data. These approaches include the bivariate choropleth map, map pixelation, glyph rotation, and the exceedance probability map. In Vizumap, there are three different types of functions - formatting, building, and viewing functions - that make it easy to create these uncertainty maps for a range of applied spatial problems.
- votesmart votesmart by Amanda Dobbyn, Max Wood, Alyssa Frazee. An R interface to the Project 'VoteSmart'<https://justfacts.votesmart.org/> API.
 vroom by Jim Hester, Hadley Wickham, Jennifer Bryan + 1 more. The goal of 'vroom' is to read and write data (like 'csv', 'tsv' and 'fwf') quickly. When reading it uses a quick initial indexing step, then reads the values lazily , so only the data you actually use needs to be read. The writer formats the data in parallel and writes to disk asynchronously from formatting.
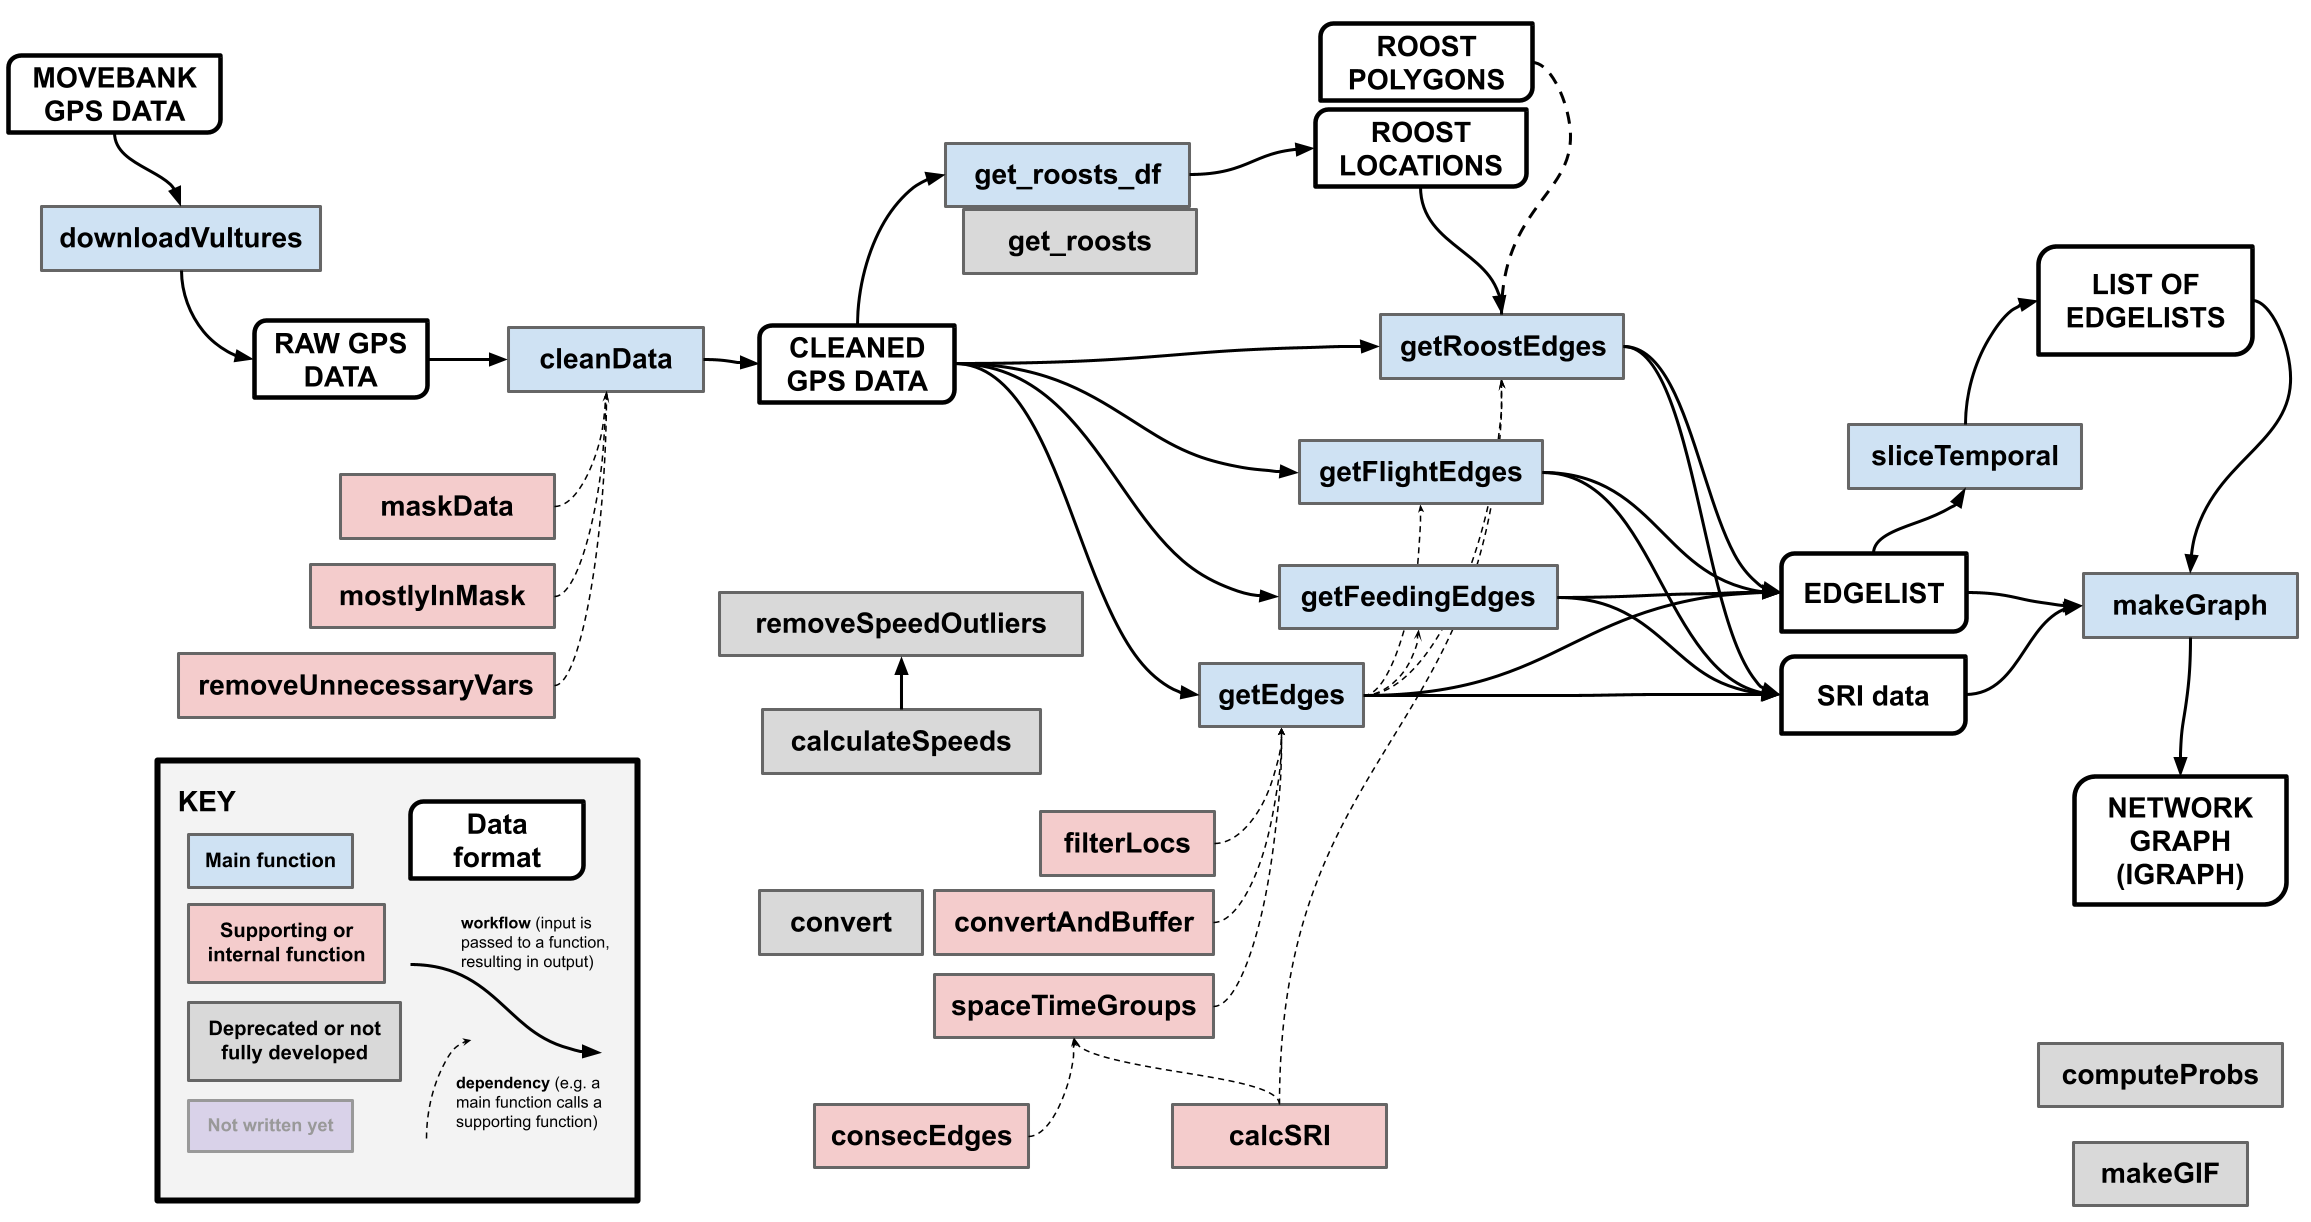 vultureUtils by Kaija Gahm. This package is designed to work with the TAU/UCLA joint NSF/BSF-supported dataset of GPS-tracked griffon vultures (_Gyps fulvus_). It automates data cleaning and the creation of social networks.
 washi by Jadey Ryan, Molly McIlquham, Dani Gelardi. Create plots and tables in a consistent style with WaSHI (Washington Soil Health Initiative) branding. Use 'washi' to easily style your 'ggplot2' plots and 'flextable' tables.
- wcep wcep by Jeffrey Bakal, Cynthia Westerhout, Sarah Rathwell + 2 more. Analyze given data frame with multiple endpoints and return Kaplan-Meier survival probabilities together with the specified confidence interval. See Nabipoor M, Westerhout CM, Rathwell S, and Bakal JA (2023) <doi:10.1186/s12874-023-01857-0>.
 weathercan by Steffi LaZerte. Provides means for downloading historical weather data from the Environment and Climate Change Canada website (<https://climate.weather.gc.ca/historical_data/search_historic_data_e.html>). Data can be downloaded from multiple stations and over large date ranges and automatically processed into a single dataset. Tools are also provided to identify stations either by name or proximity to a location.
- widyr widyr by David Robinson, Julia Silge. Encapsulates the pattern of untidying data into a wide matrix, performing some processing, then turning it back into a tidy form. This is useful for several operations such as co-occurrence counts, correlations, or clustering that are mathematically convenient on wide matrices.
 wingen by Anusha Bishop, Anne Chambers, Ian Wang. Generate continuous maps of genetic diversity using moving windows with options for rarefaction, interpolation, and masking as described in Bishop et al. (2023) <doi:10.1111/2041-210X.14090>.
- woody woody by Lise Vaudor. The woody package prepares wood occurrence data and related discharge data in order to carry out a random forest regression that predicts wood flux according to discharge history descriptors.
 workflows by Davis Vaughan, Simon Couch, Hannah Frick + 1 more. Managing both a 'parsnip' model and a preprocessor, such as a model formula or recipe from 'recipes', can often be challenging. The goal of 'workflows' is to streamline this process by bundling the model alongside the preprocessor, all within the same object.
- workflowsets workflowsets by Hannah Frick, Max Kuhn, Simon Couch + 1 more. A workflow is a combination of a model and preprocessors (e.g, a formula, recipe, etc.) (Kuhn and Silge (2021) <https://www.tmwr.org/>). In order to try different combinations of these, an object can be created that contains many workflows. There are functions to create workflows en masse as well as training them and visualizing the results.
 worrrd by Anthony Pileggi, Shannon Pileggi. Generate wordsearch and crossword puzzles using custom lists of words (and clues). Make them easy or hard, and print them to solve offline with paper and pencil!
- XICOR XICOR by Susan Holmes, Sourav Chatterjee. Computes robust association measures that do not presuppose linearity. The xi correlation (xicor) is based on cross correlation between ranked increments. The reference for the methods implemented here is Chatterjee, Sourav (2020) <arXiv:1909.10140> This package includes the Galton peas example.
- zalpha zalpha by Clare Horscroft, Clare Horscroft. A suite of statistics for identifying areas of the genome under selective pressure. See Jacobs, Sluckin and Kivisild (2016) <doi:10.1534/genetics.115.185900>.